Does Analyzing Business Decisions Through Volatility Make Sense?
October 3, 2018
A strong indicator of expected trends and opportunities credit unions are exploring is often found in the type of what-ifs requested from our clients. One of the many what-if requests we are getting is addressing deposits leaving, especially high-balance money markets. This pressure on liquidity, combined with other changes in the environment, is resulting in more challenging A/LM results.
Decision-makers are looking to evaluate liquidity options as well as strategies to create more breathing room with respect to policy limits.
For example, consider a credit union that recently crossed its +300 bp NEV percentage change limit of <-40%. In addition, ALCO had concerns about the trend of the credit union’s +300 bp NII volatility, as it has been approaching its policy trigger of <-10%.
The ALCO began to brainstorm different strategies to manage the credit union’s policy limits and triggers. Among them, the ALCO explored locking in long-term funding with a 5-year borrowing in hopes of not only reducing interest rate risk in higher rate environments but also easing liquidity pressure.
The ALCO evaluated a what-if replacing short-term member certificates and high-balance money markets expected to leave, amounting to 6% of total funding, with a 5-year, fixed-rate borrowing. At a high level, NEV results of the what-if scenario can be seen below.
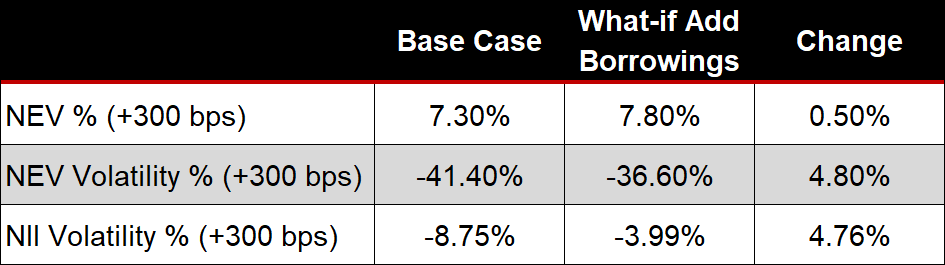
ALCO’s intuition was correct. The NEV volatility in a +300 bp shock is back within the <-40% limit. Additionally, ALCO sees the resulting NII volatility, using traditional static balance, is reduced by half as well – improving from -8.75% to -3.99%.
Decision-makers were thinking, “Seems like a pretty good deal. This is a win-win, let’s pull the trigger!” When we review NEV and static balance sheet simulation results with our clients, we continuously encourage them to look beyond volatility when evaluating business decisions because volatility does not tell the whole story.
Consider what decision-makers could be missing by focusing on NEV and NII/static income simulations. What could the +300 bp NII volatility not be communicating that would be critical decision information?
From a value (NEV) perspective, it makes sense that the credit union would be happier in the shocked environment, but what about the earnings?
If the focus of A/LM reports and policy limits is NII volatility and NEV volatility, then decision-makers will likely not see the whole picture.
In this example, the NII volatility told decision-makers there would be less earnings volatility, but what is the resulting NII in the current and shocked environments?
Which information would be most informative when making business decisions – the results shown in Option A or Option B?
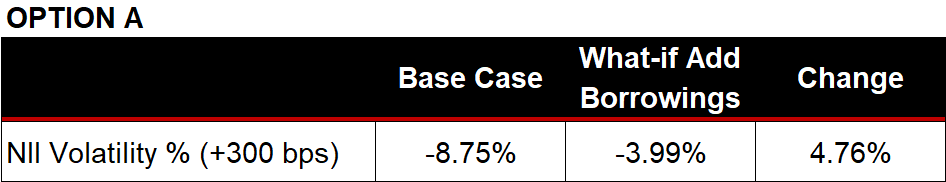
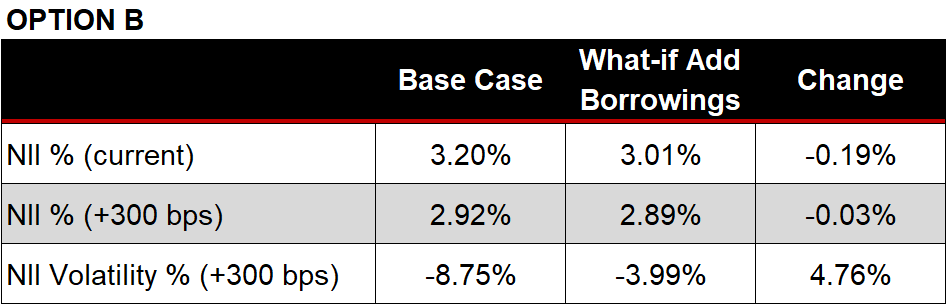
In this instance, using NII volatility as a proxy for risks to earnings does not provide decision-makers with effective decision information, so Option B would be more informative. Again, it shows that there is less NII volatility. In fact, the volatility is reduced by half, which sounds like a really good thing. Yet, the NII not only declined 19 bps in the current rate environment, it is still 3 bps lower in the +300 bp environment!
Using only NEV and NII volatility, decision-makers would be led to believe liquidity could be helped and the credit union’s A/LM position would be stronger if rates go up. The reality is that the cost of borrowings not only squeezes the margin today, but the margin continues to be tighter if rates increase 300 bps.
At this point, the ALCO should have realized that the policy didn’t help warn against the tighter margin and is also left wondering about the credit union’s bottom-line ROA.