Posts

Time To Tune Up Modeling In Down Rate Environments

,

Over the past year or so, both ends of the yield curve have risen. With an increasing focus on data integrity in A/LM modeling, performing quality control and reasonability checks on modeled outputs has never been more important.

One particular area of focus, given the increases in short-term rates over the last 12 months, is that of variable-rate loans and their behavior in A/LM modeling. For nearly 10 years, as short-term rates hovered near 0%, seeing loan yields flatten was fairly common. After all, the short-term yield simply couldn’t go much lower.

No longer, though, is this the case.

As loan yields have increased, especially on variable-rate loans that are tied to the Prime rate or similar indices, the need to monitor the behavior of those loans in both rising and falling rate environments is an integral part of reasonability checks. Take the following generic HELOC account as an example:

Current Rate Environment (as of December 2017)

Chart of generic HELOC account used as an example in modeling HELOCS showing average yields

In the current rate environment, as expected, the above example is showing pricing up an additional 25 basis points (bps) to account for the most recent increase in Prime.

-100 bp Rate Environment

Table of a generic HELOC account used in modeling HELOCs

In a -100 bp rate environment, though, the yield on this account is holding flat. Given how much rates have moved over the past year, how reasonable or realistic is it that this account would hold flat if rates fell 100 bps over the next 12 months?

Frequently, in model validations and other work we do for clients, we have seen this very thing happen. Behind the scenes, the reason this account failed to reprice down was not one based on the contractual obligation of the loans within this category, but rather a built-in function to floor this account’s yield at the current rate. This is a relic of short-term rates being at or near 0% for so long, that the rates prevented the account from repricing down in lower rate environments.

Using data that has been vetted for both quality and reasonability, this account should reprice down. While it is not a full -100 bps, given the weighted average floor on this account, its behavior is much more reasonable.

-100 bp Rate Environment

Table showing corrected generic HELOC account used in modeling HELOCs

The output of any A/LM modeling is only as good as the inputs. Without doing some standard reasonability and quality control checks on the data, you run the risk of not only having unrealistic results, but also results that could hide some risk. A/LM modeling goes well beyond results printed out on a screen, it includes thoughtful checks and balances every step of the process to drive better decision-making.

HELOC Considerations in a Rising Rate Environment

,

With the recent increase in short-term interest rates, specifically Prime rate, many credit unions are taking a closer look at the impact of higher rates on their HELOC portfolios. Anything is possible when it comes to future market interest rates but a continued increase in Prime means members will have higher interest rates and higher payment amounts. This begs the question, how much of a payment increase can members handle?

To help answer this question, a simple exercise can be performed in Excel. Come up with an approximation of the average HELOC balance. Depending on geography and the type of membership, this answer can vary widely. In some metro markets, credit unions have found their average HELOC balance to be close to $100,000. Even if the average HELOC balance is lower than this, consider the fact the member may have student loans or credit cards that are also potentially affected by an increase in Prime. For purposes of our example, assume an average HELOC balance of $75,000.

To keep the example simple, consider just the HELOC interest payment, not even building in principal paydown. This is important to acknowledge because many HELOCs from the real estate boom (2005-2007) are at the end of their 10-year draw period. This could add considerable pressure to the monthly payment, as some will start paying down principal at a time when interest rates might be going up.

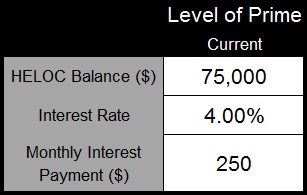
Prime is currently at 4.00%, which results in a monthly interest payment of $250 based on a balance of $75,000.

d3

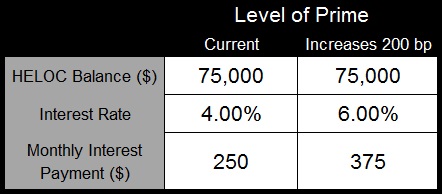
If Prime continues to increase, have a discussion and try to answer the question, could the member afford another 200 basis point (bp) increase in Prime?

d22

The members’ monthly interest payment has increased from $250 to $375, representing a $1,500 increase on an annual basis. Perhaps a conclusion is reached that, sure, our members could handle that increase.

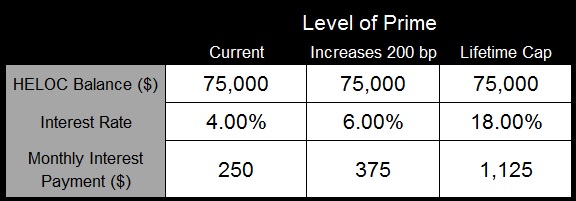
Consider a more dramatic change in Prime. If the lifetime cap on the HELOC portfolio is 18%, determine if you feel the member could handle an increase to that level.

d11

The members’ monthly interest payment has increased from $250 to $1,125, representing a $10,500 increase on an annual basis. At this point many decision-makers might arrive at the conclusion that members can’t absorb an increase in Prime of this magnitude. If there is agreement that the member can handle a 200 bp increase in Prime but can’t handle a 1400 bp increase in Prime, somewhere in the middle is an implied cap on the benefit of having this variable rate product.

Once there is a consensus on how much payment increase the member can handle, the interest rate risk modeling becomes easier. Every HELOC portfolio has the potential to be unique but take a look at the characteristics and consider incorporating a more restrictive periodic cap in you’re A/LM modeling or increasing prepayments to account for this risk.

The value is in the discussion, especially if the credit union is counting on HELOCs offsetting interest rate risk in higher rate environments.

Has Your ALM Technology Emerged From the Dark Ages?

, ,

In this wonderful world of amazing technological advances, member-facing technology provides convenience and ease of access that was unimaginable in the past.  Huge strides have also been made in supporting technologies, such as putting relevant data at employees’ fingertips for cross-selling, automated loan decisioning, and mining member data for marketing opportunities.  The same can be done for asset/liability management (ALM).

ALM modeling used to require hours to run on early computers and, before that, you can imagine how long it took to do the calculations using paper and pencil. Of course, those early methodologies had to be simple and it was impossible to render results quickly, so people got used to slow analyses that were already irrelevant by the time they were complete.  ALM was relegated to a dusty back room and offered to regulators to satisfy their check boxes.

Fast-forward to today – if ALM is not being used to make business decisions in real time, it may signal the need for a mindset change.  A vast array of decisions – from changing the loan portfolio to adding branches or reducing operating expense – can be tested for their impact on profitability and the risk profile.  Imagine sitting around a table discussing ideas and initiatives, and testing their potential profitability under numerous economic conditions.

ALM modeling has come a long way and deserves a place at that table, serving as one of the pillars good decision-making rests on.  This type of decision-making links strategy and desired financial performance for long-term success.

Now more than ever, it is important to view ALM as a powerful weapon to help remain relevant as competition and consumer preferences continue to change. Demand more from your ALM and start using it to help gain and maintain that competitive edge.


Observations From ALM Model Validations: High Starting NEV Ratios

When performing model validations, it is common to see a net economic value (NEV) ratio that is considerably higher than the credit union’s current net worth ratio. Understanding NEV and net worth are two completely different concepts; there are reasons why starting with a high NEV ratio in the base environment may not be reasonable.

First, let’s discuss some of the reasons why this can occur:

  1. Non-maturity deposits are assumed to have long average lives. Given the positive slope of the yield curve, this assumption results in higher discount rates and optimistic market value premiums
  2. The credit union does not incorporate transaction spread costs when valuing deposits, which overstates the value to the credit union
  3. Optimistic loan discount rates, that ignore credit and other market risks, results in overly optimistic loan market values

Consider that NEV is intended to show the fair value of a credit union. Therefore, mergers can be used as a reasonableness check of this critical component of modeling. Mergers over the last several years do not support the assertion that an acquiring institution would pay a significant premium to the net worth.

It is important to understand that optimistic base NEV results also impact volatility ratios in various rate shocks. To keep the math simple, consider a $100 credit union performing NEV with two different sets of assumptions. For example purposes, the dollar volatility in a +300 basis point (bp) shock is assumed to be the same while, in reality, the more optimistic assumptions in Assumption B would result in a lower dollar volatility.

Model validations with high NEV ratios inaccurately predict volatility

Many have said that the reasonableness of the starting NEV doesn’t matter; it is the volatility that should be the focus. Notice that while the two sets of assumptions in this example have the same dollars of volatility in a +300 bp shock, the percent volatility and NEV ratio in a +300 bp shock are dramatically different. The NEV in Assumption A may be considered high risk, while the NEV in Assumption B may be considered low to moderate risk.

If using NEV, credit unions should focus not only on NEV volatility but should also understand what their base NEV ratio is showing and if it is reasonable. If the starting NEV ratio is considerably higher than the net worth ratio, the credit union needs to understand why. If it is not defendable, credit union management should consider making adjustments to assumptions.

How is Your Modeling Positioned to Capture NCUA’s “Chief Concern”?

In the most recent NCUA Economic Update, John Worth (Chief Economist, NCUA) outlined NCUA’s chief concern regarding the impact of a changing rate environment, given an interpretation of recent Federal Reserve comments and data analysis. See below for a key quote from the video:

“If the increase in short rates is larger than the increase in loan rates, that is if the yield curve becomes flatter, credit unions could likely see a narrowing of net interest margins. We have already noted that non-interest income has moved lower recently. If that trend continues while net interest margins are also shrinking, many credit unions will face declining net income or even losses. Here at NCUA, our chief concern is that credit unions are aware and prepared for this possibility. Credit unions should have a firm idea of how their income statements and balance sheets are affected by a rapid rise in short-term rates, and they should have a plan for dealing with the potential consequences [emphasis added].”

Credit unions that rely on static balance sheet measures of non-interest income volatility, net economic value simulations and parallel rate changes will miss the impact on their financial structures of NCUA’s chief concern – the simultaneous impacts of a compressed net interest margin and a decline in non-interest income. As conventional methods of risk management lack the ability to quantify this key risk, credit unions using such methods must turn instead to their budgeting process. However, does the current budget process enable “what-if” scenario analysis that can incorporate the possibility of rising short-term rates? Said differently, how could your credit union’s earnings and financial structure change if cost of funds increases and new asset yields remain stagnant, thus further compressing already historically low net interest margins?

Understanding the possible impacts to planned strategies in the event rates begin changing in 2015 would add valuable information to the decision-making process. Let’s say a budget “what-if” includes a rate change and margin increase through lagged deposit pricing assumptions and aggressive movements in loan and investment portfolio new volume rates. The impact on the base budget in this “what-if” should be fairly clear – earnings increase. This is especially true if such a change in rates does nothing to alter assumptions regarding consumer behavior (i.e., projected loan volumes and deposit funding mix from the base budget do not change).

Management teams should include an analysis of the impact on earnings and financial structures from an increase in short-term rates only, leaving long-term rates flat, in their budget “what-ifs” (projections) and scenario analysis. This is especially important if the risk management tool utilized in the A/LM process lacks the ability to inform the credit union of this risk.