Posts

Of Bulls and Bears – Margin Impact from Changing Yield Curves

,

After the blog published on April 21, 2016, we have received a number of comments regarding why we were silent on the industry “conventional wisdom” that a wider yield curve can provide stronger net interest margin, and that a narrower yield curve can squeeze the margin. This can be true, but often is not. All else being equal, a wider yield curve would produce stronger margins. However, real life seldom results in an “all else being equal” outcome. Business, and the economic climate, are not static. There are constant changes to the regulatory, economic, and competitive landscape that can (and does) change consumer behavior – and the changes in consumer behavior result in changes and shifts in credit union financial structures.

Bear Flattener

If we were to apply “conventional wisdom” to the most recent “bear flattener,” which occurred from 2004 to the end of 2005, real world results are not what would be expected. In June 2004, the industry net interest margin was 3.26%. In June 2006, the industry margin had barely moved down, reaching 3.20%. This barely quantifiable movement in margin happened when the yield curve moved from roughly 350 basis points (bps) to about 20 bps – a reduction in steepness by more than 300 bps.

Using the “all else being equal” argument, margins may have been squeezed more. However, there was a mitigating factor that helped to preserve the margin – the loan-to-asset ratio for the industry increased more than 5% over that same time frame. The increase in the loan-to-asset ratio helped to offset margin pressures that could have been realized if “all else being equal” loan demand had not increased.

Bear Steepener

Applying the same conventional wisdom to a recent “bear steepener,” which occurred from 2012 to 2013 long-term rates increased more than 100 bps, translating to a yield curve that is roughly 100 bps wider than it was December 2012. However, net interest margin for the industry dropped from 2.94% to 2.80%. Comparing the end of 2012 to the end of 2015, the yield curve has been consistently steeper and loan-to-asset ratios jumped 7% (to 65%), but the margin of 2.86% has not rebounded to the 2012 level.

Now, some may argue that there were so many other variables and moving pieces in the broader economic climate, “all else being equal” or using an “apples to apples” comparison, margins should have increased. That may be the case. The same arguments are brought up in relation to static income simulation. Breaking it down into the fundamental components, everyone realizes that real life isn’t static – things change, member demands and consumer behaviors shift, and the competitive landscape has a significant impact on credit union earnings and risk profiles. The entire reason for the thought that wider yield curves bring stronger margins is a lack of change in the composition of assets and liabilities in static income simulation. This is antiquated thinking that has resulted in potentially misleading “conventional wisdom.”

Conventional Wisdom can be Misleading

As an industry, we have seen yield curves widen (steepen) and yield curves narrow (flatten), loan-to-asset ratios increase and loan-to-asset ratios decrease, with inconclusive correlations between changes in the yield curve in relationship to actual bottom-line net interest margins. Credit union management teams, boards of directors, and even regulators should be concerned with an assumption of static replacement regardless of the change in the environment, as it is often misleading. For decades we have been modeling a huge range of yield curves and environments, and this experience has taught us the importance of modeling how members may respond differently in these environments. Additionally, it has demonstrated that better business decisions can be made by first understanding the potential profitability (or losses) from the existing structure, prior to layering on guesses about what the new business may be able to do in all of the different environments.

Of Bulls and Bears – Twisting the Yield Curve Is More Than Just a Stress Test

,

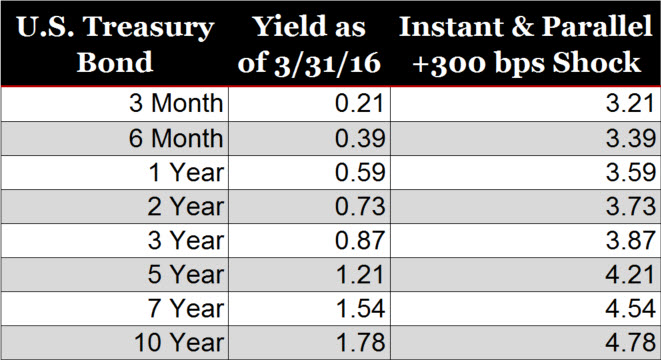
If you’re a financial institution, you need to understand how changes in market rates could affect your financial well-being. That’s what A/LM analysis is for. Traditional A/LM analysis has revolved around simple, instantaneous, and parallel shifts in rates. But in reality, rates have rarely shifted in parallel (not to mention instantaneously). As an example, using the interest rate environment and yield curve at the end of March, an instant and parallel change in rates would result in the below rates:

twisting the yield curve, c. myers. credit union,

Each of the rates increases 300 basis points (bps) and the relationship between the short- and long-term rates does not change. While the above approach does represent a change in interest rates, there is no change in the yield curve. In the +300 bps change in rates, the spread between the 3 month and the 10-year yield is 1.57% – which is exactly the same as it was on March 31. An effective interest rate risk management program must include an analysis of the impact to earnings and net worth caused by a shift in the relationship between short- and long-term rates. This is referred to as twisting the yield curve. As that relationship changes, it results in yield curves that are either flatter (meaning the difference between short- and long-term rates decreases) or steeper (meaning the difference between short- and long-term rates increases). And, depending on the financial structure, flatter and steeper yield curves may produce very different financial effects.

“Bullish” Twists

The yield curve is said to twist in a bullish manner when the Federal Reserve is expected to lower interest rates.

A bull flattener is characterized by long-term rates decreasing more than short-term rates. This yield curve shift can cause disproportionate reaction across a credit union’s balance sheet, typically influencing longer-term assets or liabilities more than short-term assets or non-maturity deposits. For example, cost of funds may not change much (as the short-term rates tend to influence cost of funds on non-maturity deposits), but longer-term assets like mortgages may experience an increase in prepayment speeds (as decreases in long-term rates typically correlate with decreases in mortgage rates and more refinance activity). A good historical example of a bull flattener is the movement in Treasury rates experienced in 2011, when long-term rates dropped roughly 150 bps, moving from 3.36% at the start of the year to 1.89% at the end of the year. Short-term rates moved 13 bps, dropping from 0.15% to 0.02% over the same period.

Bull Flattener, c. myers, yield curve twists

A bull steepener, on the other hand, is characterized by short-term rates falling faster than long-term rates. The most recent bull steepener occurred from the middle of 2007 to the end of 2008, when the yield curve shifted from a slightly inverted/flat curve as short-term rates dropped roughly 500 bps and long-term rates dropped only about 250 bps over that 18-month timeframe.

“Bearish” Twists

The yield curve is said to twist in a bearish fashion when there is an expectation that the Federal Reserve will increase interest rates.

A bear flattener is characterized by short-term rates rising faster than long-term rates. This yield curve twist tends to increase non-maturity deposit rates, without a significant corresponding increase in long-term rates. This can cause pressure on net interest margins, and can often cause non-maturity deposit migration (movements from non-maturity shares into more expensive short- and intermediate-term certificates of deposits). The most recent bear flattener occurred from the middle of 2004 to the end of 2005, when long-term rates moved nominally, but short-term rates increased over 300bps during that 18-month period.

bear flattener, twisting yield curve, c. myers, credit unions

Conversely, a bear steepener is characterized by long-term rates increasing faster than short-term rates. This yield curve twist tends to slow down existing asset prepayments, and not influence non-maturity deposit behavior. The most recent example of a bear steepener occurred from the middle of 2012 through the end of 2013, when short-term rates hardly moved but long-term rates moved in excess of 100 bps.

Twisting the Yield Curve Is More Than Just a Stress Test

The examples above represent a fraction of the possible effects of yield curve changes. A myriad of factors play into how a bull flattener, bear steepener, or any yield curve change will affect the earnings and net worth of a given financial structure. Member behavior factors – members exercising their options to refinance loans or shift deposits between non-maturity deposits and certificates – can have significant impact when the yield curve changes. Understanding the impact to profitability in a wide range of rate environments and yield curves, and the resulting impact to net worth, should not be simply a stress test – it should be a matter of course in any effective interest rate risk management program.