OBSERVATIONS FROM ALM MODEL VALIDATIONS: DO DECAY RATES MATTER?
Yes. Decay rates do matter, but they are often not appropriately applied in the asset/liability management (ALM) process. Decay rates are essential for capturing the risk of evolving member behavior, namely deposit migration, as rates change. This blog will focus on using decay rates when simulating net economic value (NEV).
Model validations typically reveal two common issues as it pertains to the setup and implementation of deposit decay rates.
1) Decay rates are not being incorporated
Model users are often surprised to find out decay rates are not being incorporated. Common reasons for this include the fact that input fields can be hard to locate or reports summarizing key assumptions are not reported effectively (sometimes assumptions reported in a summary are not actually the assumptions in the model). To better illustrate, lack of decay rates from a recent model validation were organized by c. myers in the table below.

The risk of decay rates not being incorporated in NEV can be dramatic, especially in the various rate shocks. If decay rates are not included, it will result in longer deposit cash flows, an unrealistic market valuation of deposits and, ultimately, an understatement of interest rate risk in a rising rate environment.
Credit unions should check their ALM models to make sure reasonable decay rates are appropriately applied and coincide with key assumption reporting.
2) Decay Rates Do Not Change As Market Rates Change
The issue of decay rates not changing as the world around us changes was discussed during a blog in September 2014. Back then, we pointed out that,
[Assuming decay rates don’t change as market rates change] is like saying non-maturity deposit cash flows will remain constant and unchanging regardless of what rates do. History shows that this is not a valid assumption and, if used, can provide a false sense of security regarding NEV results.
In the table below, c. myers organized decay rates from a recent model validation we performed.

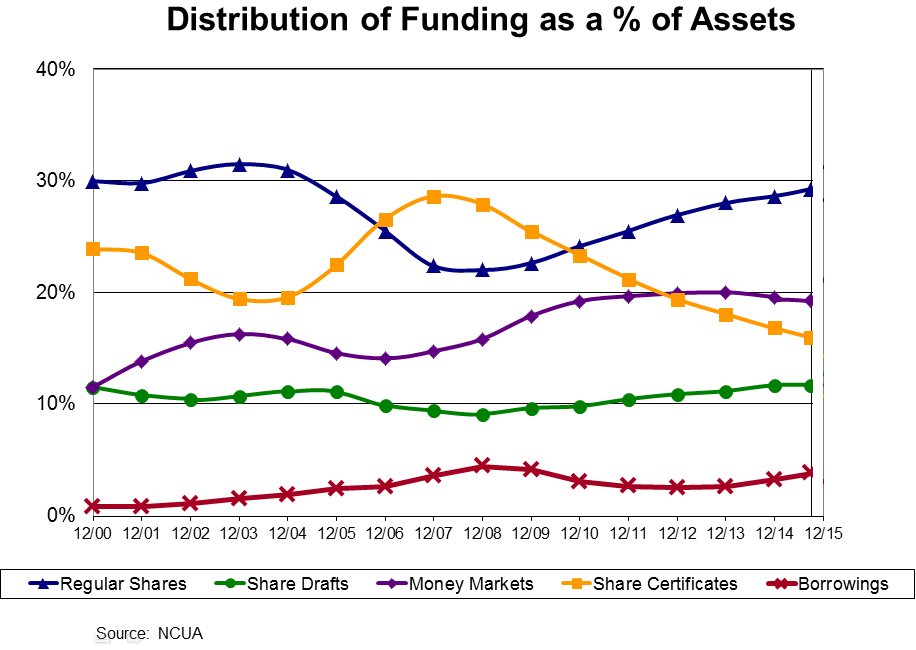
Notice that while decay rates are unique for the three different deposit products, decay rates remain constant regardless of changes in market rates. Said differently, this model assumes members will not consider the evolving advantage they might have to withdraw funds as rates change. However, as demonstrated in the chart below, history does not support the assumption that member behavior does not change as rates change.
The following graph shows when market rates increased from roughly 1% to 5% in 2004 and 2005, the industry experienced a material decrease in the concentration of regular shares and increase in member CDs. However, over the past 8 years, that trend has reversed as member certificates have declined while regular shares have experienced significant growth.

Keep in mind as you review decay rates, it is not about getting the “right” assumption, because that is virtually impossible. It is about reasonably representing changes in consumer behavior in your base-case risk analysis, then stress testing a range of assumptions to understand the impact.
While the focus of this blog has been on NEV, deposit behavior is a material component of income simulations as well. Ignoring deposit and member behavior will understate the cost of funds in higher rate environments and likewise hide risk. This is an issue that shows up with the static balance sheet approach and has been discussed frequently in previous blogs. To learn more, refer to the links below.
Observations from ALM Model Validations: Cost of Funds Back Testing
Observations from ALM Model Validations: Extremely Profitable New Business ROA in Static Balance Sheet Simulations
Isolating Interest Rate Risk with a Static Balance Sheet

