Posts

Is The Yield Curve Flattening?

,

Going back to the end of 2015, the Federal Reserve has lifted the Fed Funds rate up from its zero lower bound to target a range of 1.25% to 1.50%, with additional tightening anticipated in 2018.

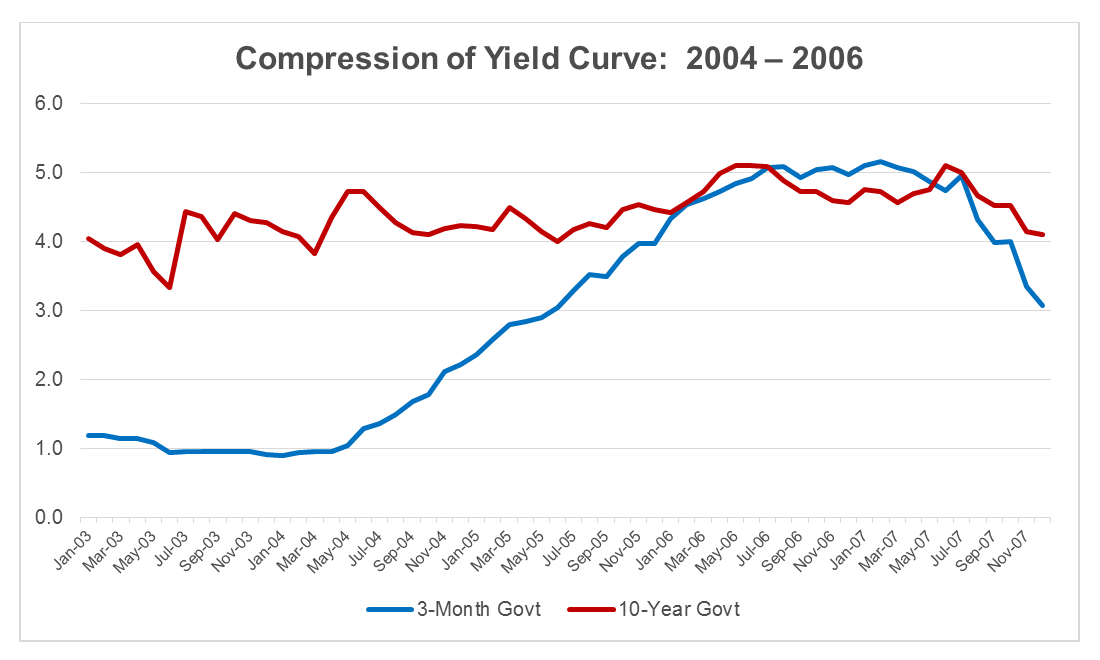
Often, when places model risk, it is assumed that when short-term rates move, long-term rates will move parallel.  Thus, when short-term rates increase, it is often expected that long-term rates will also increase—but this is often not the case.  From 2004 to 2006, the Fed raised the Fed Funds rate from its target of 1.00% up to 5.25%.  Short-term rates responded, but long-term rates did not move very much.  This led to then-Federal Reserve Chairman Alan Greenspan’s “conundrum” comment and an inverted yield curve:

A graph showing the compression of yield curve, 2004-2006

Since longer-term rates influence yield on assets, and shorter-term rates influence cost of funds, the difference between short- and long-term rates is important for credit union earnings.  When the difference is larger it can help credit union margins, and when short- and long-term rates are closer together, it can squeeze margins.  A sophisticated model should automatically change the shape of, or “twist,” the yield curve with every simulation and what-if scenario that is modeled.

The importance of twisting the yield curve on every simulation and what-if scenario cannot be overlooked.  During the tightening from 2004 to 2006, for example, cost of funds for credit unions $1 billion to $10 billion in assets increased 1.27%, while the yield on earning assets increased just 0.88%, according to NCUA data.  This move took about a 40 bp bite out of these credit unions’ net interest margins.

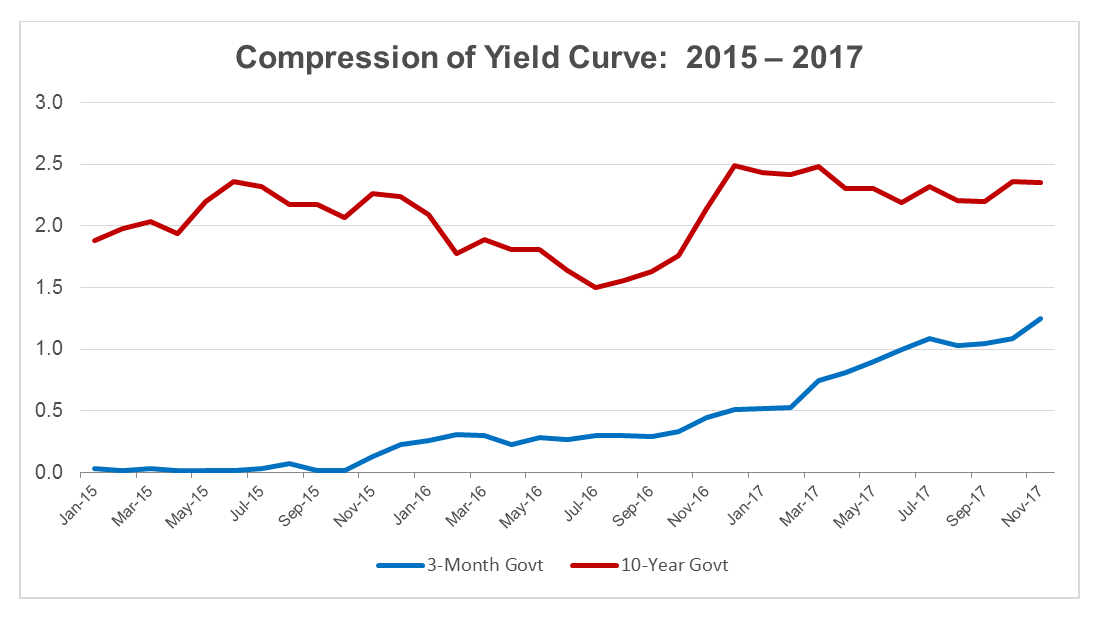
As we look at recent history, we see that, once again, as the Fed is tightening its rates, the yield curve is compressing.  Will it flatten out or invert as it did the last time the Fed tightened?  No one knows, but it is compressing:

A graph showing the compression of yield curve, 2015-2017

Assuming a parallel increase will generate a higher yield on assets and will result in a higher simulated margin than may be experienced with yield curve compression.  Often, twists of the yield curve are incorporated into modeling once per year as part of stress testing.  Compression of the yield curve as the Fed tightens is not a stress test.  History has shown this to be a common expectation.  We run thousands of simulations and what-if scenarios every year, each one of them testing a wide range of rate environments and yield curve shapes.  We encourage every institution to incorporate the real risk of yield curves changing in every simulation.

Pay Attention to Liquidity

, , ,

As we conclude our budget and forecasting work with many credit unions, we continue to see expectations for loan growth to exceed share growth in 2017. Combining this trend with an assumption for higher interest rates could squeeze liquidity positions in 2017.

Callable bonds may no longer get called and mortgage related assets will extend if rates increase. In addition, deposit growth could slow or shift to more expensive deposits.

While we recently posted a blog on liquidity, we felt it was important to give another reminder to do advance planning in this arena.

Test your liquidity position under various scenarios. If you see pressure beyond your comfort zone, now is the time to have the strategic conversations about how the credit union will be prepared to respond without sacrificing longer-term strategic objectives.

Know Your Numbers: 4 Questions You Should Answer About Your Lending Experience

,

Interest rates may go up and interest rates may go down, but a laser focus on your member experience is essential, regardless of what interest rates do. Just about every credit union has easy access to the data needed to answer the following 4 key questions about the lending experience:

  1. Are we attracting enough of the right types of lending opportunities? In other words, is our appetite for credit risk aligned with our marketing efforts? Quality applications from identified target markets outweigh volume
  2. From the consumer’s perspective, how long does it take before they get a decision? Auto-decisioning is not being fully utilized in the industry. Remember auto-decisioning is not just saying yes. Often, credit unions that auto-decline actually fund more of the loans that they approve because they have more time to devote to the loans they want to make
  3. What is our look-to-book by branch and digital delivery channels? It is not uncommon to see that the digital delivery channel is not truly “owned” in the credit union. Service level agreements and processes are not clear
  4. What are our funding rates for applications taken outside of normal business hours? Credit unions that study this metric find huge opportunity to increase funding. The digital world increases expectations exponentially. Waiting to get a decision on Monday for a loan application submitted on Saturday will not cut it

The questions above simply scratch the surface. Credit unions have access to high-quality data. Credit unions that turn this data into easily digestible, actionable business intelligence enjoy higher funding ratios. Equally important, their member experience is truly rewarding.

You can’t control interest rates but you can control your member’s experience. Maintaining a laser focus on that experience is a key to success in every rate environment.

Interest Rate Risk in an Auto Loan – Really?

, ,

The competitive landscape for auto loans has fundamentally changed over the last 15 years.  There are more non-traditional lenders vying for autos and non-credit union lenders have been saturating the indirect lending market.

These trends put pressure on pricing and take a bite out of the auto lending pie.  As a result, financial institutions are getting creative with pricing and terms.  As this occurs, questions to consider need to evolve.

One example is the increase in 10-year auto loans, which we are seeing as we conduct interest rate risk simulations.

Consider:

  • How might prepayments differ from a shorter-term auto loan?
  • Is it reasonable to assume that a consumer wanting a 10-year auto will prepay the loan at the same rate as a 5-year auto loan?

There is not an abundant amount of prepayment data on this type of loan to answer the questions above, so, test the impact.  In the table below, notice the escalation in average life as well as the balance remaining after three years and five years.  If the prepayment rate on this term of auto loan is 10% then more than half of the balance would remain after three years, and nearly one-third would remain after five years.

10 Year Auto Loan Table SM 080416

So yes, these loans bring more interest rate risk.  If these types of loans become more prevalent, it will be important to change mindsets with respect to interest rate risk and auto loans, not to mention the risk of negative equity that comes hand in hand with the extended term.

Consider the potential impact of CECL on longer-term auto loans.  For example:

  • What if the auto loan is actually underwater for a material portion of the time it is outstanding?
  • Do the potential risks mean financial institutions should not do long-term auto loans?  There is no easy answer or one-size-fits-all response.  Each executive team needs to decide their product offering in light of their value proposition, appetite for risk, and financial strength.

What we do know is that the questions need to evolve to appropriately identify and manage the risk.

Brexit’s Effect On Your Business Model

, ,

Except for those that have been on vacation in a very remote location, all of us have heard or read countless reports about how voters in The United Kingdom (UK) decided to leave the European Union (Brexit), and predictions about the impact to the global economy (Source). This decision will have long-term implications, as UK is the fifth largest economy in the world (Source), and the second largest in the European Union. Thinking strategically about how Brexit and other events that create uncertainty can impact the business model of their credit union is key. Below are brutal facts and a strategic scenario to consider.

Brutal Facts
Margins are squeezed and Brexit can cause more squeezing. On June 1, 2016, the US 10-year Treasury yield was about 1.85%, already very low by historical standards. On the day following the Brexit vote, due to a spike in uncertainty that Brexit created, the yield was down to 1.57%, a decline of 28 basis points (bps) from earlier in the month and nearly 17 bps from the day before. The 10-year Treasury influences the interest rate charged for longer-term loans, such as mortgages.

Germany is the fourth largest economy in the world, followed by UK as the fifth, as noted earlier. As 2014 got underway, Germany’s 10-year government bonds were trading at 1.94% and UK’s were trading at 3.03%. Both rates have been trending downward in order to “jolt lending, spur inflation, and reinvigorate the economy after other options have been exhausted” (Bloomberg, Negative Interest Rates, June 6, 2016). Of particular note, the day following the Brexit vote, Germany’s 10-year bond was trading at a negative interest rate of (0.05%) and UK’s at 1.09%. At that time, Japan, the world’s third largest economy, had a negative yield on its 10-year government bonds.

Strategic Thinking: Rehearse Tomorrow Today
Consider a process which you have regularly scheduled meetings with a team of key players, such as monthly or quarterly, during which the only thing on the agenda is rehearsing tomorrow today, discussed in a previous blog about strategic planning (http://www.cmyers.com/preparing-for-strategic-planning/).

Identify a trend that is happening, such as negative interest rates in other large economies. Create a future scenario in which those trends continue or expand. Ask your team to discuss what that future could look like and list out all areas of the credit union that could be impacted, and be sure to estimate and simulate the financial implications of the scenario, as well as actions the team would consider. Remember, nothing happens in isolation, so combine events.

An example of a scenario about negative interest rates follows. Imagine it is 2018 and the US has slipped into a modest recession, which was triggered, in part, by the uncertainty created in Europe from the passage of Brexit. Loan demand declines and delinquencies increase. The value of the dollar continued to rise as the value of the Euro and British Pound dropped, making US products even more expensive to the rest of the world. Also, increasing uncertainty caused a flight to safety worldwide. The safest investment is US Treasury debt. As a result, the US 10-year Treasury yield is 0.75%, half of what it was at in June 2016, and shorter-term rates, such as the 3-month and 1-year Treasury bills, are paying negative yields. Current 30-year mortgage rates are 2.50% and competitive rates for auto loans to quality borrowers hover around 0.40%. You are being charged 0.10% to hold cash in an overnight account.

  • What is happening with home sales in your area?
  • What is happening with auto sales?
  • Are your savers saving more or less money?
  • How are you pricing your loans?
  • How are you pricing deposits?
  • Are you charging fees on some deposit accounts?
  • Is there an impact to non-interest income?
  • Because the margin is squeezed further, what are alternative sources of income you can leverage?

Resilient organizations are that way for a number of reasons. One is because they rehearse tomorrow today. Leaders of these organizations are deliberate about preparing their organizations for thriving during disruptions. Negative interest rates may not be the next big disruption, but your preparation for it may help you to thrive during other disruptions.