Is The Yield Curve Flattening?
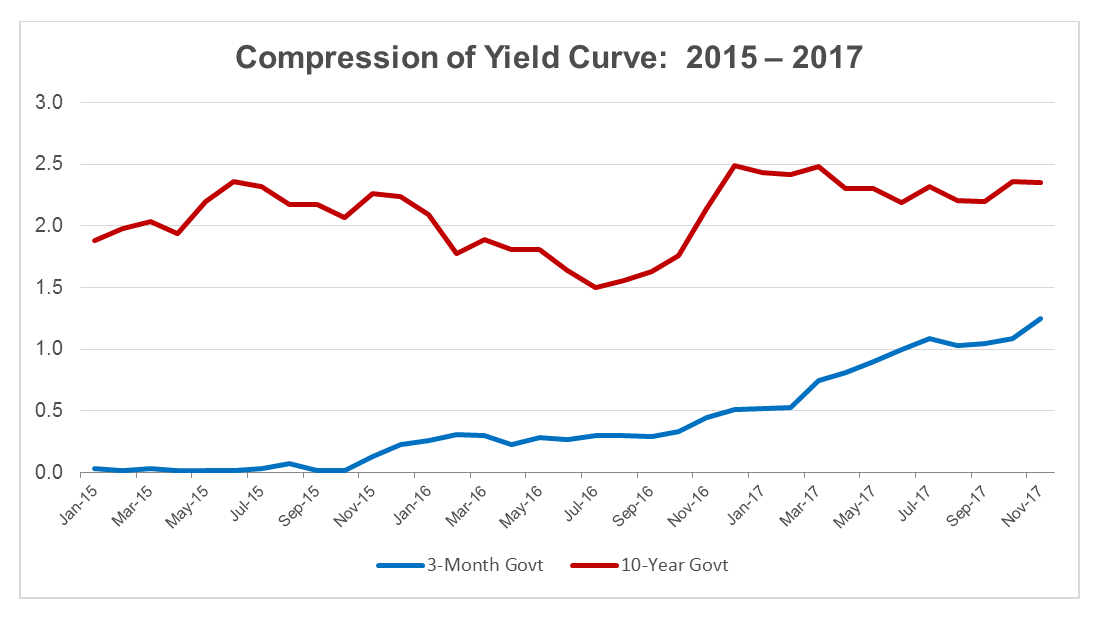
Going back to the end of 2015, the Federal Reserve has lifted the Fed Funds rate up from its zero lower bound to target a range of 1.25% to 1.50%, with additional tightening anticipated in 2018.
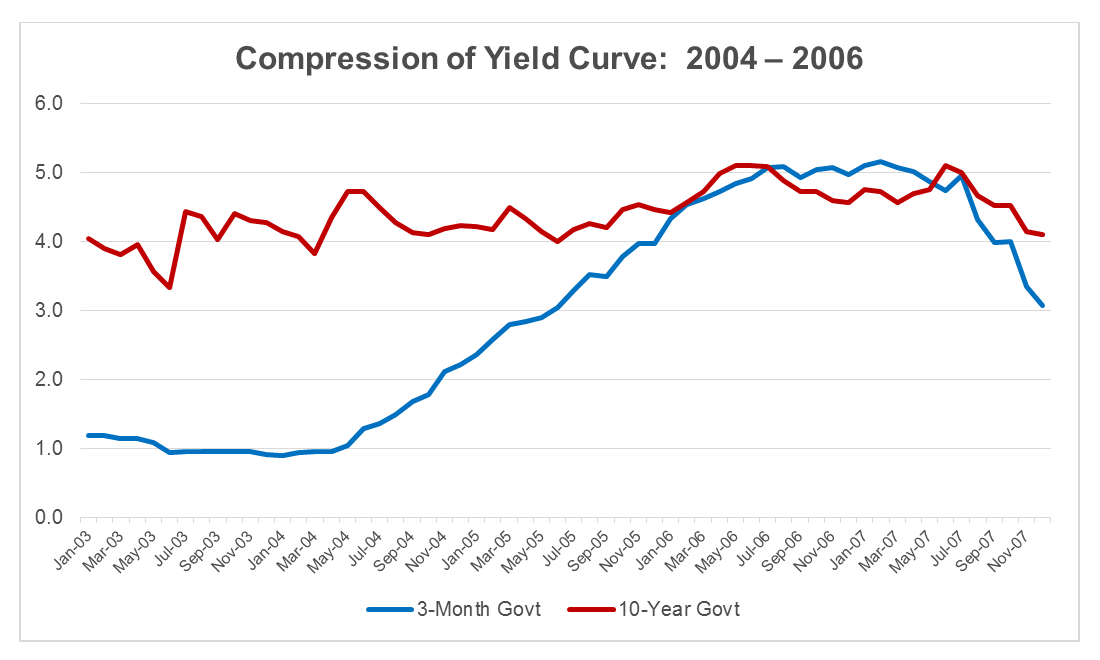
Often, when places model risk, it is assumed that when short-term rates move, long-term rates will move parallel. Thus, when short-term rates increase, it is often expected that long-term rates will also increase—but this is often not the case. From 2004 to 2006, the Fed raised the Fed Funds rate from its target of 1.00% up to 5.25%. Short-term rates responded, but long-term rates did not move very much. This led to then-Federal Reserve Chairman Alan Greenspan’s “conundrum” comment and an inverted yield curve:
Since longer-term rates influence yield on assets, and shorter-term rates influence cost of funds, the difference between short- and long-term rates is important for credit union earnings. When the difference is larger it can help credit union margins, and when short- and long-term rates are closer together, it can squeeze margins. A sophisticated model should automatically change the shape of, or “twist,” the yield curve with every simulation and what-if scenario that is modeled.
The importance of twisting the yield curve on every simulation and what-if scenario cannot be overlooked. During the tightening from 2004 to 2006, for example, cost of funds for credit unions $1 billion to $10 billion in assets increased 1.27%, while the yield on earning assets increased just 0.88%, according to NCUA data. This move took about a 40 bp bite out of these credit unions’ net interest margins.
As we look at recent history, we see that, once again, as the Fed is tightening its rates, the yield curve is compressing. Will it flatten out or invert as it did the last time the Fed tightened? No one knows, but it is compressing:
Assuming a parallel increase will generate a higher yield on assets and will result in a higher simulated margin than may be experienced with yield curve compression. Often, twists of the yield curve are incorporated into modeling once per year as part of stress testing. Compression of the yield curve as the Fed tightens is not a stress test. History has shown this to be a common expectation. We run thousands of simulations and what-if scenarios every year, each one of them testing a wide range of rate environments and yield curve shapes. We encourage every institution to incorporate the real risk of yield curves changing in every simulation.


