6 minute read – Has your team had a chance to take a close look at your ALM modeling recently? COVID has certainly created a lot of distractions, so it may not have been at the top of your ALCO’s priority list. However, this low-rate environment has created some unique pressures on EVE/NEV and NII modeling. This blog will touch on a couple of these common modeling issues and provide ways to address them.
Deposit Pricing Betas
Do your deposit pricing betas connect well to recent history? Deposit pricing betas can be backtested pretty readily for short-term rates ranging between 0% and 2%. For example, what was your institution paying on savings in the 3rd quarter of 2019 when short-term rates were at about 2%? If your savings rate, for instance, was 30 bps in 2019 and you are paying 0.10% today when short-term rates are near 0%, your actual historical beta over that range of rates would be 10% (a 20 bps change in savings rate over a 200 bps change in market rates).
So how would a 10% beta compare to what is being reflected in your modeling? It is not uncommon to see betas on savings of 25% to 45%. For example purposes, lets split the difference between 25% and 45%, and assume your institution was using a savings beta of 35%. What would that mean for the simulated savings rate if market interest rates went back up 200 bps? It would increase the savings rate to 80 bps compared to the 30 bps actually paid! This would potentially overstate cost of funds in an income simulation, and it will impact the value of deposits in the EVE/NEV analysis.

Of course, no one knows what the environment will be like going forward. At the end of the day, an 80 bps savings rate could be reasonable at 2% market rates, depending on market conditions and pressures, but this is definitely an area that institutions should double-check and understand. And while it can be okay to be conservative, decision-makers should understand what is happening as they balance current earnings with strategic progress and risk tolerance. A challenge here is that many institutions do not realize that their assumptions and recent history are so different.
If you did choose to adjust betas in the lower rate environments, how could you accomplish that? One way would be to use different betas for different rate environments. In the example noted above, a 10% beta could be used for 1% and 2% short-term rate environments, and then different pricing betas could be applied if rates were to increase above 2%. Some institutions will look back to the 2006-2007 timeframe to understand how they priced deposits when short-term rates were at the 5% level. This is used as a starting point to inform the betas that will be used.
Impacts of the Low-Rate Environment on Deposit Values
What if our current EVE/NEV ratio is materially lower than our book capital? This is a great question, and it is important to get clarity on the answer. The reason may be due to how the deposits are being valued. Asset values are generally helping EVE/NEV results when market rates are low. However, on the other side of the balance sheet, deposit values are generally providing less benefit in the EVE/NEV calculation, which is hurting the results.
Directionally, this is reasonable – as the spread between the cost of funding and the cost to replace funding is much narrower than it was just 15 months ago. However, it’s the magnitude of the change, specifically in non-maturity deposit values, that should be closely scrutinized. As we perform model validations, we are finding that many ALM models are showing non-maturity deposits having a materially negative impact on the EVE/NEV results in the base rate environment and, as rates rise, we will see this issue become relevant for the down rate environments.
So, what is happening? Consider an example of a financial institution with 10% capital and assets being modeled at a 2% premium today. Based on that little bit of information, you might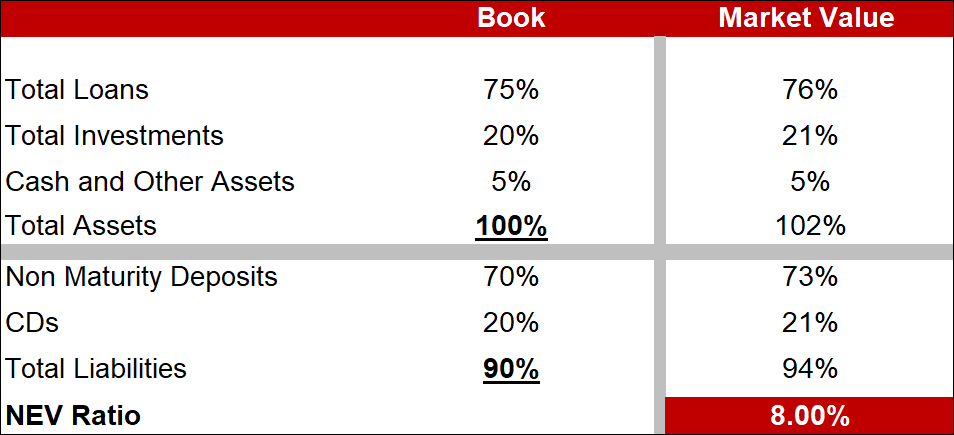 expect the EVE/NEV ratio to be near or above 10% since assets are being reflected at a benefit. Frequently though, we are seeing EVE/NEV ratios well below the level of book capital, with the most common cause being the way that non-maturity deposits are discounted and valued. In this example, the EVE/NEV ratio is 8% and non-maturity deposits are valued at a 3% loss to the institution’s EVE/NEV.
This impacts not only the EVE/NEV ratio today, but also the volatility and the ratios in other rate environments.
Step back and really consider the reasonableness of these types of results. If your institution sold non-maturity deposits, under what circumstances would you have to take a 3% loss? Most likely, you could return the deposits to your customers at par.
It is important to note that with longer-term rates rising in recent months, this issue may become less pronounced as the replacement rate for deposits has been increasing along with market rates. However, market rates could certainly fall again, which would magnify this issue. And even if rates don’t decrease again any time soon, this issue will impact the modeling of deposits in the “down” rate environments when “low” market rate environments are being simulated.

Are either of these issues impacting your institution’s ALM modeling? It is a good idea to get clarity and develop a comfort level with how things are being modeled, so your team has more confidence in the results they are providing, regardless of where rates go. Stress testing assumptions can help your team understand how key assumptions are impacting the results. And while it can provide comfort to err on the side of being conservative when it comes to assumption settings, there is risk in that approach.
The trick is finding a balance, because whether intentional or not, being too conservative could mean that risk is being overstated, and this could mean passing on critical business opportunities today.