602-840-0606
Toll-Free: 800-238-7475
contact@cmyers.com
| Cookie | Duration | Description |
|---|---|---|
| cookielawinfo-checkbox-analytics | 11 months | This cookie is set by GDPR Cookie Consent plugin. The cookie is used to store the user consent for the cookies in the category "Analytics". |
| cookielawinfo-checkbox-functional | 11 months | The cookie is set by GDPR cookie consent to record the user consent for the cookies in the category "Functional". |
| cookielawinfo-checkbox-necessary | 11 months | This cookie is set by GDPR Cookie Consent plugin. The cookies is used to store the user consent for the cookies in the category "Necessary". |
| cookielawinfo-checkbox-others | 11 months | This cookie is set by GDPR Cookie Consent plugin. The cookie is used to store the user consent for the cookies in the category "Other. |
| cookielawinfo-checkbox-performance | 11 months | This cookie is set by GDPR Cookie Consent plugin. The cookie is used to store the user consent for the cookies in the category "Performance". |
| viewed_cookie_policy | 11 months | The cookie is set by the GDPR Cookie Consent plugin and is used to store whether or not user has consented to the use of cookies. It does not store any personal data. |
Best Laid Plans
Strategic Planning Blog PostsOver the next few months, credit unions will be going through their strategic planning process to discuss the direction and goals for the credit union going forward. Often, we see actionable game plans with the best intentions to stay focused on implementation, which is when the real tough work begins.
Following are just a few tips to not allow the whirlwind of operations (or of life) to get in the way of strategic implementation (and the best laid plans):
Each organization should set working agreements on how to maintain focus that suits the culture and ensures the success of the strategic plan. Ultimately, the key is to make sure the working agreements don’t let the whirlwind of real life take priority over strategic implementation.
Observations from ALM Model Validations: Cost of Funds Back Testing
ALM Blog PostsIn the course of working with hundreds of credit unions and performing A/LM model validations, one area of weakness we see is in assumptions related to the cost of funds. Quite often, the modeled cost of funds does not (without good reason) represent historical costs as rates rise.
There are two major assumptions that influence cost of funds: Pricing strategy (betas) and deposit mix changes.
On the pricing, consider studying actual rates the credit union paid when rates were at 5% in the summer of 2007. If you are assuming the credit union won’t have to pay as much, why?
Another component to consider is the mix of funds as rates rise. The table below highlights how the distribution of funds is different in low and traditionally more “normal” rate environments.
Credit Unions $500M and Above
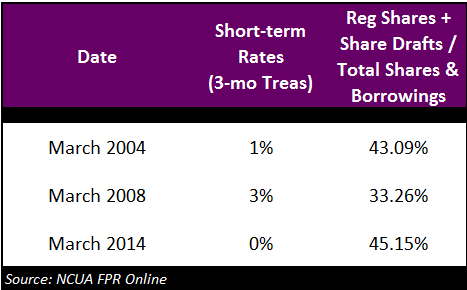
A good way to do a reasonableness check on the modeled cost of funds is to compare the total resulting cost of funds to the total cost of funds the credit union experienced historically, for example in 2007.
If the simulated cost of funds does not back test to history, you may be using a model that only applies decay assumptions to NEV and not the income simulation. This happens frequently.
Another reason could be that you are doing a static balance sheet simulation. Static balance sheet simulations ignore the risk of the deposit mix changing. This, of course, will water down the estimated cost of funds.
There can be supportable reasons why the cost of funds does not back test to history. However, we typically find that the simulation methodology used is driving this difference.
Model Risk Management
ALM, Interest Rate Risk Blog PostsModel risk involves the use of financial models, and the potential that errors in setup, input, or interpretation of results can lead to material misstatement of results. Model risk can be present in internally created financial models or in vendor-supplied financial models and/or results.
Having a model’s mathematics validated periodically (important only if there is a change to the underlying software and/or application of the software) can be one way to reduce model risk. However, what about errors in the setup, data input, or interpretation of results? Beyond periodic, formal written model validations, how can decision-makers limit their exposure to model risk? Below are some key items that those involved in financial modeling should consider to aid in reducing model risk:
Financial modeling should provide decision-makers with useful and relevant information to aid in the decision-making process. Ensuring that a robust system for mitigating model risk exists can help ensure the reliability of that information.
What Are Some Things to Consider as Part of the Budget Process?
Budgeting Blog PostsWe help a lot of institutions with the creation of their budgets and long-term forecasts. There are many questions that often arise as part of that process. The most common question is, what rate environment should I plan on?
There is no easy answer to this question; the reality is that whichever environment gets incorporated in the budget has a good chance of being wrong.
Fed Chair, Janet Yellen, described this same challenge during a speech in May:
“I am describing the outlook that I see as most likely, but based on many years of making economic projections, I can assure you that any specific projection I write down will turn out to be wrong, perhaps markedly so.” (Source: Janet Yellen just made one of the most surprising admissions you’ll ever hear from an economist, Yahoo Finance, 5/22/15)
The Federal Open Market Committee (FOMC) will meet September 16 and 17 and many anticipate a decision could be made to increase the Federal Funds target rate for the first time in nearly 10 years. However, forecasts have the potential to not come true, which becomes evident when comparing the Federal Funds rate projection from December 2014 versus the most recent projection.
Source: Economic Projections of Federal Reserve Board Members and Federal Reserve Bank Presidents, Federal Reserve, 12/2014
The average expected target range for year-end 2015 and 2016 were 1.12% and 2.54%, respectively. The most recent forecast of Federal Reserve Board Members and Bank Presidents from June 2015 reflects a 2015 and 2016 year-end average that is approximately 0.50% and 1.00% lower than the December 2014 projection.
Source: Economic Projections of Federal Reserve Board Members and Federal Reserve Bank Presidents, Federal Reserve, 6/2015
The danger in relying on rate forecasts or projections is the potential for not understanding the risk of rates remaining at the same level they are today. As many management teams begin the planning process and budgeting for next year, a key consideration should be testing the impact on the budget of rates not moving as forecast. In fact, a combination of a base prediction along with a range of expectations around that base path can help uncover potential strains to the margin.
Beyond the rate environment, some other common budget questions have to do with growth. Whatever the credit union may plan in the future, it can be valuable to test the potential of those assumptions being wrong. With advanced modeling capabilities, the time it takes to run each of the following tests should be minimal.
Some example tests:
Note that the unique exposures of your institution might need very different questions. Our recommendation throughout the budgeting process is to not spend so much time trying to prove that you know what will happen in the future, but rather make sure to focus on reasonable expectations and then test the exposure to the institution if those expectations do not come true.
Forward Curve Back Testing
Interest Rate Risk Blog PostsOur last blog, NEV Does Not Equal NII, drew questions from some of our readers. Specifically, some questioned our comment about a forward curve’s inability to predict interest rates. This is fair, since some in the industry seem to treat it as a foregone conclusion that a forward curve will come true.
We hear a lot about back testing so let’s back test a forward curve. The table below looks at the 3-month LIBOR forward curve on the last day of October each year going back to 2007 for its “prediction” of where the 3-month LIBOR rate would be on October 31, 2014. The numbers have changed a little bit since then, but the message remains clear: a forward curve has not proven to be a good predictor of interest rates.
For example, the forward curve as of October 31, 2007, “predicted” that, as of October 31, 2014, the 3-month LIBOR would be 5.37%. As of October 31, 2013, the forward curve was indicating the 3-month LIBOR to be 40 bps on October 31, 2014. The actual rate as of October 31, 2014, was about 23 bps.
Does your IRR process use a forward curve to predict rates?
Baseball legend Yogi Berra is credited with saying “It’s tough to make predictions, especially about the future.” We couldn’t agree more! Predicting rates can be good as part of the budgeting process but, when it comes to risk simulations, history has taught us that a forward curve is poor predictor of future rates. If your IRR process assumes the base rate environment will follow a forward curve, you could be missing risk. Understanding the risk of rates staying flat or not following a forward curve are lessons that should not be ignored. For this reason, we run IRR analyses that analyze potential earnings against the backdrop of all the interest rate environments including all of the yield curve twists that have happened in the last 60+ years.