Real-Time Financial Forecasting: The Fed Is on the Move
September 25, 2024
|
|
Q: When the Fed has significantly cut rates, how many times has the yield curve shifted in parallel?
A: ZERO!
What does this mean for you?
In a world filled with uncertainty, this is one thing you can count on. So, don’t rely solely on parallel shifts in the yield curve when modeling. Expand your analysis to capture more realistic scenarios.
It is important to show other decision-makers the financial outcomes depending on the shifts in the yield curve. Technology has advanced so that this dynamic is easy and fast to model.
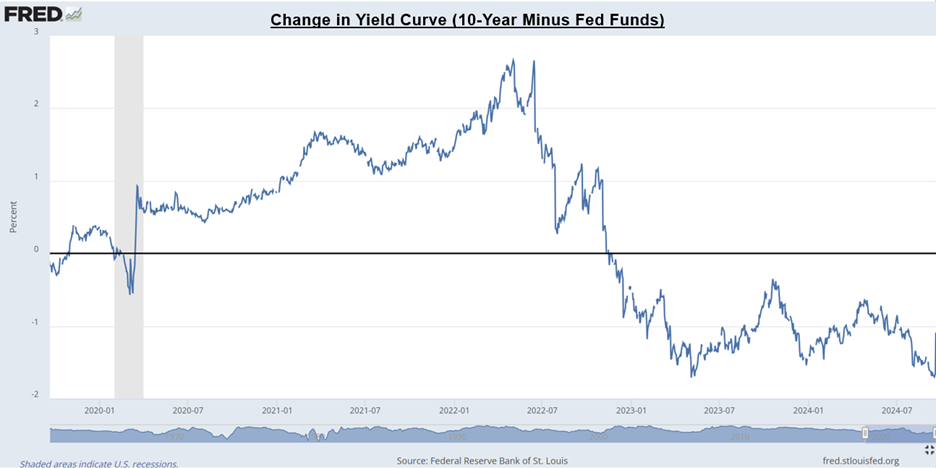
In days gone by, this would have taken hours of hard labor to show the potential financial outcomes of yield curve shifts, especially over a time horizon of more than 1 year – hence the simplifying assumption of parallel shifts. See the graphs below as a reminder. They show the change in the yield curves since January 2020.
Here are just a few scenarios being requested by decision-makers to understand the range of possible outcomes:
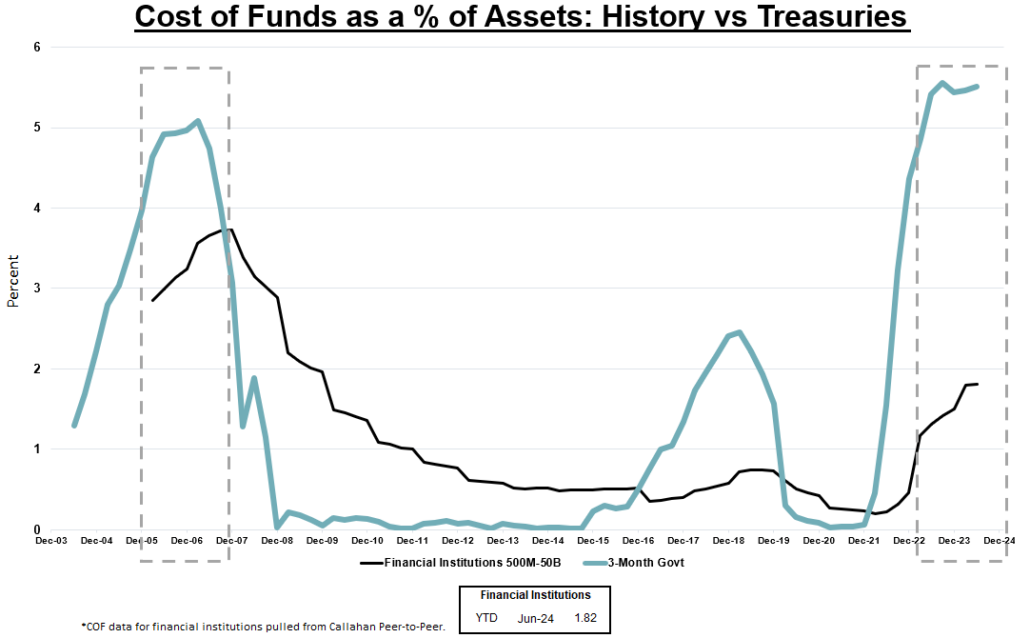
1. What if as rates come down, we experience FOMO on CDs, (like we have when mortgage rates ticked up) and our CD demand increases, putting more pressure on COF, before it declines? Learn from history, many financial institutions experienced this the last time rates were around 5% (2006-2007).
2. What if the yield curve continues to flatten? Long-term rates come down, refinancing kicks in significantly, and our COF does not decline the way we anticipated?
3. Same situation in number 2, but people don’t refi with us, and we have to invest?
4. What if our business lending hits a rough patch with respect to credit risk? As a result, do we respond by tightening our standards and volumes decline?
5. What if number 3 and 4 happen simultaneously?
6. What if our organization experiences a big mortgage refi boom – what portion should we hold or sell?
7. How do we hold up in the Fed stress tests?
8. What if the Fed cuts rates much faster than we anticipated and our prepayments on loans accelerate significantly beyond expectations? How might we need to adjust our KPIs to accommodate?
9. What if we need to achieve our KPIs by materially lowering our expected yields? Is the trade-off of volume vs rate worth it?
10. What if the situation in the Middle East causes inflation to ramp back up?
These scenarios can be run in front of the entire C-Suite team in a matter of 1-4 minutes. This can result in the decision-information being shared with the Board so everyone could be on the same page with respect to a range of potential scenarios and financial outcomes. This helps the organization be much more agile in optimizing their financial structures for many reasons. One key reason is a significant increase in appreciation for all the moving pieces.
Each quarter, take your current financial structure and run these scenarios to see how the outcomes can change. As appropriate, also add any significant emerging trends.
Leadership and Boards value what they refer to as real-time financial information. Some of them equate it to the push notifications they receive from their financial institutions and wealth-management advisors. It keeps them forward-looking.


