Of Bulls and Bears – Twisting the Yield Curve Is More Than Just a Stress Test
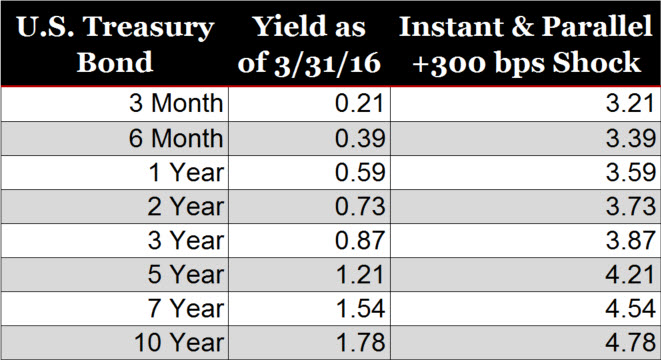
If you’re a financial institution, you need to understand how changes in market rates could affect your financial well-being. That’s what A/LM analysis is for. Traditional A/LM analysis has revolved around simple, instantaneous, and parallel shifts in rates. But in reality, rates have rarely shifted in parallel (not to mention instantaneously). As an example, using the interest rate environment and yield curve at the end of March, an instant and parallel change in rates would result in the below rates:

Each of the rates increases 300 basis points (bps) and the relationship between the short- and long-term rates does not change. While the above approach does represent a change in interest rates, there is no change in the yield curve. In the +300 bps change in rates, the spread between the 3 month and the 10-year yield is 1.57% – which is exactly the same as it was on March 31. An effective interest rate risk management program must include an analysis of the impact to earnings and net worth caused by a shift in the relationship between short- and long-term rates. This is referred to as twisting the yield curve. As that relationship changes, it results in yield curves that are either flatter (meaning the difference between short- and long-term rates decreases) or steeper (meaning the difference between short- and long-term rates increases). And, depending on the financial structure, flatter and steeper yield curves may produce very different financial effects.
“Bullish” Twists
The yield curve is said to twist in a bullish manner when the Federal Reserve is expected to lower interest rates.
A bull flattener is characterized by long-term rates decreasing more than short-term rates. This yield curve shift can cause disproportionate reaction across a credit union’s balance sheet, typically influencing longer-term assets or liabilities more than short-term assets or non-maturity deposits. For example, cost of funds may not change much (as the short-term rates tend to influence cost of funds on non-maturity deposits), but longer-term assets like mortgages may experience an increase in prepayment speeds (as decreases in long-term rates typically correlate with decreases in mortgage rates and more refinance activity). A good historical example of a bull flattener is the movement in Treasury rates experienced in 2011, when long-term rates dropped roughly 150 bps, moving from 3.36% at the start of the year to 1.89% at the end of the year. Short-term rates moved 13 bps, dropping from 0.15% to 0.02% over the same period.

A bull steepener, on the other hand, is characterized by short-term rates falling faster than long-term rates. The most recent bull steepener occurred from the middle of 2007 to the end of 2008, when the yield curve shifted from a slightly inverted/flat curve as short-term rates dropped roughly 500 bps and long-term rates dropped only about 250 bps over that 18-month timeframe.
“Bearish” Twists
The yield curve is said to twist in a bearish fashion when there is an expectation that the Federal Reserve will increase interest rates.
A bear flattener is characterized by short-term rates rising faster than long-term rates. This yield curve twist tends to increase non-maturity deposit rates, without a significant corresponding increase in long-term rates. This can cause pressure on net interest margins, and can often cause non-maturity deposit migration (movements from non-maturity shares into more expensive short- and intermediate-term certificates of deposits). The most recent bear flattener occurred from the middle of 2004 to the end of 2005, when long-term rates moved nominally, but short-term rates increased over 300bps during that 18-month period.

Conversely, a bear steepener is characterized by long-term rates increasing faster than short-term rates. This yield curve twist tends to slow down existing asset prepayments, and not influence non-maturity deposit behavior. The most recent example of a bear steepener occurred from the middle of 2012 through the end of 2013, when short-term rates hardly moved but long-term rates moved in excess of 100 bps.
Twisting the Yield Curve Is More Than Just a Stress Test
The examples above represent a fraction of the possible effects of yield curve changes. A myriad of factors play into how a bull flattener, bear steepener, or any yield curve change will affect the earnings and net worth of a given financial structure. Member behavior factors – members exercising their options to refinance loans or shift deposits between non-maturity deposits and certificates – can have significant impact when the yield curve changes. Understanding the impact to profitability in a wide range of rate environments and yield curves, and the resulting impact to net worth, should not be simply a stress test – it should be a matter of course in any effective interest rate risk management program.

