Posts

Don’t Hit Cruise Control on Auto Loans

,

Auto sales, which have been at record levels and hit a peak of 17.8 million units last year according to CU Times, may be reaching a plateau. If your earnings are heavily reliant on sustained and significant production in auto loans, think strategically about the following:

  • There are indications of changing behaviors affecting market demand. Licensed drivers as a percentage of their age-group population
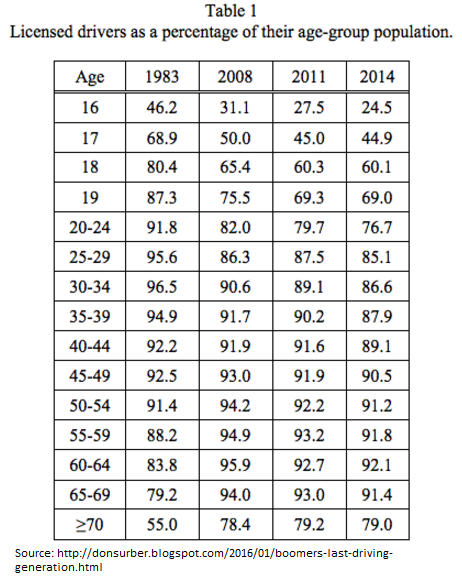
    • In 2008, 65.4% of 18 year-olds had a driver’s license. Now, that is down to 60.1% (Source: Yahoo! News).
    • In all age groups from 16-69, the percent of Americans with a license has fallen since 2008 (Source: Yahoo! News).
  • It is important for decision-makers to think through potential implications if these trends continue. Not only could it impact loan demand, but consider possible reduction in non-interest income as a result of reduced sales of related insurance products, as well as the impact on membership growth, particularly for those credit unions that are heavily reliant on indirect lending.
  • Credit risk appears to be on the rise. Some of the increase could be by design as more credit unions have strategically taken on more credit risk.
    • According to TransUnion, the national auto loan delinquency rate increased from 1.16% in Q4 2014 to 1.24% in Q4 2015 – the highest level since Q4 2010 when auto delinquency hit 1.22% (Source: CU Today).
    • According to Callahan & Associates, since 2013 (when this data for autos first became available for autos), credit union auto loan charge-offs are up from 0.43% to 0.62% in 2016, a 44% increase.
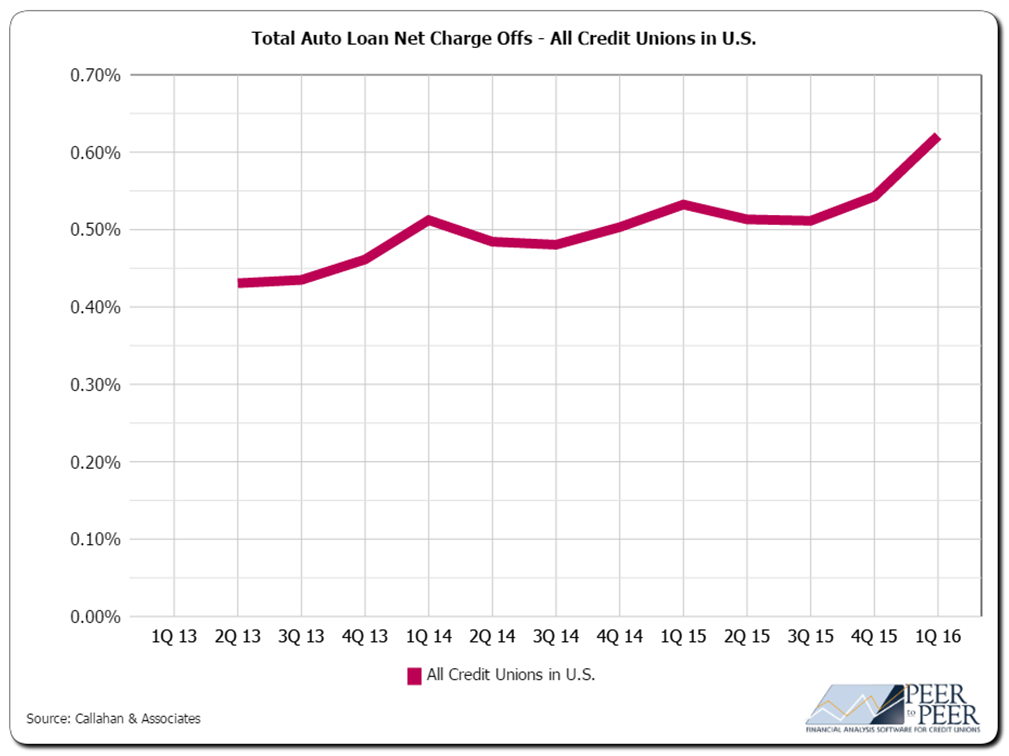
Callahan & Associates Total Auto Loan Net Charge Offs Graph

  • According to American Banker, industry analysts are communicating expectations for used car values to fall significantly in 2016 and 2017, as a large number of leased vehicles come back into the market and create a glut of inventory.
    • This could also impact credit risk. But consider the impact it could have on loan production. If the average prices are lower, how many more auto loans would you need to make to have the same loan volume? If it is materially more, what is the impact on operations?

Many credit unions have enjoyed significant growth in autos.
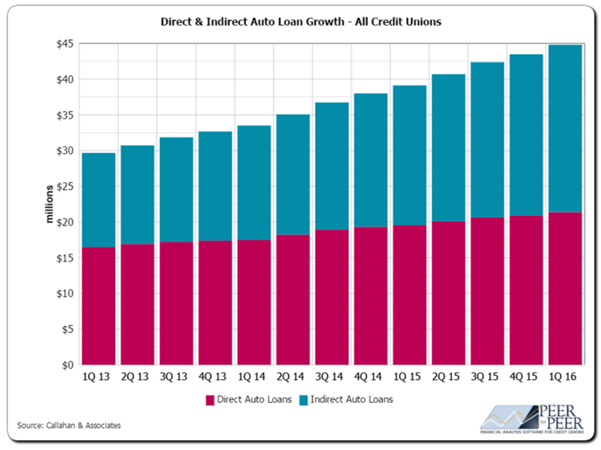
Callahan & Associates Direct & Indirect Auto Loan Growth Table
As you strategically evaluate your competitive position with respect to auto lending, don’t lose sight of these three basics:

  1. Fierce competition for auto loans is a fact. With credit union net interest margins below 3% on average, pricing effectively for risk and profitability is not optional. And this means taking it to bottom-line profitability. Don’t stop at the margin when analyzing pricing.
  2. Material decline in autos loans can directly impact other strategic initiatives, particularly those that are costly. You have to generate money to spend it!
  3. Markets change, sometimes quickly. Keep aware of the industry and competition in the market. Identify trends. Listen for concerns. Ensure the ALCO and the board are informed and discussing the potential impacts to the credit union’s booked loans as well as new business efforts, especially if the credit union is highly reliant on continued new production of auto loans.

Interest Rate Risk Modeling—Do The Results Make Sense?

Many credit unions are increasing the number of “What-Ifs” they run. It is important that decision-makers do a gut check on the results being presented.  It is also important to understand that various modeling methodologies may need to be used to ensure appropriate evaluation of the decision.
Take, for instance, a decision to expand auto lending into lower credit tiers.  This decision may prove beneficial to help preserve shrinking margins.  However, taking this potential scenario and running it through a traditional net interest income simulation and NEV will show there is virtually no risk in making this type of decision, assuming the loans are priced near the effective discount rate.
Net interest income and NEV will not address the credit risk component.  In this case, the question that must be answered is, “how will earnings and net worth be impacted by the shift in assets?”  In this example, provision expense should also be adjusted to represent the risk of the shift in assets.  If applicable, collections, legal and other expenses should also be adjusted, to capture the economic reality of increasing credit risk.
Ultimately, any decision that could result in a material change to a credit union’s financial structure should be simulated and all potential financial impacts should be considered, including net operating expenses.  The results should be shared with decision-makers and all should be asking “does this make sense?” and “is there any other impact not captured by the modeling?” to ensure that modeling results do not lead decision-makers astray.

Net Interest Margin and Risk Limits

A/LM measurement systems, policies and defined risk limits are intended to help ensure that credit unions do not take unacceptable risks relative to their insurance—which is net worth. While this sounds straightforward, much depends on the measurement system and policies in place.

Consider the example of a credit union that uses net interest income (NII) to manage risk and has established NII limits in policy. These types of limits are typically based on a percent volatility compared to today’s NII (click here for a related c. notes article on this topic).  By taking more credit risk, the credit union could improve their NII today—as a result of higher asset yields—thus reducing their volatility and, in some cases, putting them back within policy limits.

However, NII misses an important piece of the risk puzzle—the impact of increasing credit risk.  Recall that NII ignores any losses due to increasing credit risk since it is calculated before dealing with net operating expenses.  As a result, the credit union could be within its volatility limits yet unintentionally increase risks to net worth to unacceptable levels when accounting for credit risk.

Ultimately, the risk management process should help decision-makers understand threats to bottom-line earnings and most importantly, net worth.  Therefore, taking a comprehensive approach to taking, managing and aggregating risk is essential. This comprehensive approach should include all strategy levers—yield on assets, cost of funds, operating expense, PLL and non-interest income.

This approach also ties to the NCUA IRR Rule, which stated that “net worth is the reserve of funds available to absorb the risks of a credit union, and it is therefore the best measure against which to gauge the credit union’s risk exposure.”

SILO RISK MANAGEMENT NEEDS TO STOP

Many credit unions are beefing up their risk management process.  However, a critical component of the risk management process that is missing for many is evaluating and managing risk in aggregate.

According to conventional wisdom, risk is quantified and managed in silos—including interest rate risk (IRR), credit risk, concentration risk, etc.  External forces no longer support this conventional wisdom as the world has changed.  Our belief is that decision-makers and regulators need to have a more comprehensive view of risk by attempting to quantify and manage risks related to the entire financial structure.

To read the full article, click here.

Excerpt: Silo Risk Management Needs To Stop

Many credit unions are beefing up their risk management process.  However, a critical component of the risk management process that is missing for many is evaluating and managing risk in aggregate.

According to conventional wisdom, risk is quantified and managed in silos—including interest rate risk (IRR), credit risk, concentration risk, etc.  External forces no longer support this conventional wisdom as the world has changed.  Our belief is that decision-makers and regulators need to have a more comprehensive view of risk by attempting to quantify and manage risks related to the entire financial structure.

To read the full article, please see our c.notes page, available here.