Interest Rate Risk Management: Timing of Earnings Matters
Would it surprise you that some interest rate risk mitigation strategies actually add risk for a period of time? In the end, these strategies may be effective at mitigating interest rate risk but it may take years for the effectiveness to be felt. The challenge is that many methods used to test mitigation options, like NEV, don’t show decision-makers the full picture. The reality is that earnings and the timing of earnings matter when understanding the impact of different decisions.
Take for example, a credit union that decides to sell $90.0 million of its 30-year fixed rate mortgages earning 3.61% and reinvest in auto participations earning 1.90% to mitigate interest rate risk. No surprise that such a move hurts earnings today. In fact, it would hurt earnings by 23 bps.
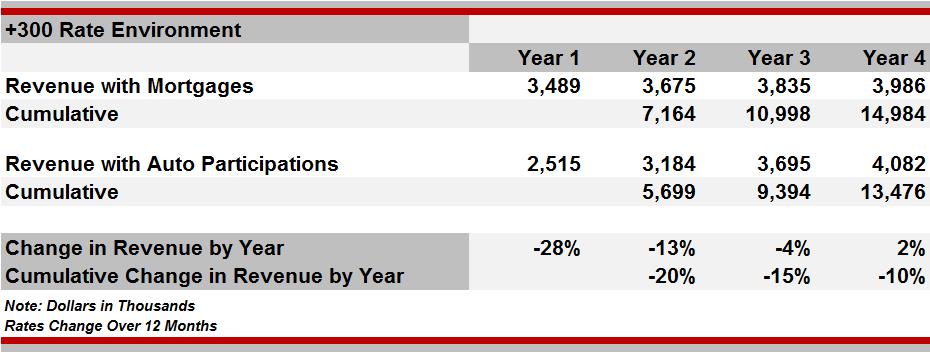
What is not obvious, though, is that in a +300 bp interest rate environment they would give up more cumulative revenue with a strategy to hold auto participations than with a strategy to hold fixed-rate mortgages over a four-year time horizon. Year-by-year and cumulative revenues for both strategies are summarized below:
The credit union would earn more revenue holding fixed-rate mortgages than holding auto participations for each of the next three years. It is not until Year 4 that the strategy change pays off and they earn more holding auto participations. Over the four-year period, the credit union would earn a cumulative $15.0 million with mortgages versus $13.5 million with auto participations in the +300 bp increase. Timing of earnings matters.
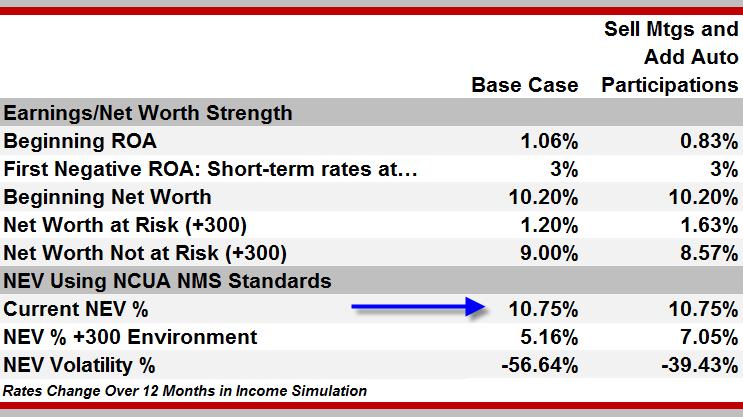
Using only NEV to evaluate this strategy might lead the credit union to pull the trigger on it. In this case, the credit union is using NCUA’s NMS values from the NEV Supervisory Test. When comparing the proposed strategy to the base, the NEV in the current rate environment is unchanged at 10.75% – meaning the restructure neither helps nor hurts the current NEV.
However, after selling the mortgages, the volatility decreased in the +300 bp environment leaving a higher NEV ratio (see example above). An added benefit is that the credit union would now be considered low risk under NCUA’s NEV Supervisory Test thresholds. Said differently, the NEV results show decision-makers would not have to sacrifice a thing in the current rate environment while significantly reducing risk in a +300 bp interest rate change.
Earnings (see Beginning ROA), on the other hand, show there is sacrifice in the current rate environment and more risk to earnings and net worth in a +300 bp rate environment over a four-year time frame.
The moral of this story is not that all credit unions should always hold mortgages because they will earn more than other alternatives. Certainly, not. It should be clear, though, that NEV provides credit union decision-makers with a limited picture. Earnings and the timing of earnings matter. In this particular example, the credit union may decide to execute the strategy, but decision-makers understand, in advance, that even if interest rates rise quickly, it could take about four years before the alternative strategy will contribute positive earnings and start to reduce interest rate risk.
For more in-depth ways to use ALM as actionable business intelligence, please click here for our c. notes.


