Posts

Interest Rate Risk Policy Limits: One Big Misconception

We initially published the blog below on January 28, 2016.  With interest rates having increased recently – and more increases seemingly on the horizon – we thought this a good topic to revisit as it has been coming up in model validations we complete.

We often see interest rate risk policy limits that rely too much on net interest income (NII) volatility and miss the absolute bottom-line exposure. Such reliance can cause boards and managements to unintentionally take on more risk than they intended.  Why?  Because these types of policy limits ignore strategy levers below the margin.

Establishing risk limits on only part of the financial structure is a common reason for why risks are not appropriately seen. Setting a risk limit focused on NII volatility does not consider the entire financial structure and can lead to unintended consequences.

For example, assume a credit union has a 12-month NII volatility risk limit of -30% in a +300 environment. The table below outlines their current situation and the margin and ROA they would be approving, as defined by policy, in a +300 bp rate shock.

17-03-buz-repost-image-1

By definition, the credit union is still within policy from an NII perspective but because of the drop in NII, ROA has now decreased from a positive 0.50% to a negative 0.43%. This example helps demonstrate that stopping at the margin when defining risk limits can result in a false sense of security.

Not All 30% Declines are Created Equal

To punctuate the point, let’s apply the 30% volatility limit to credit unions over $1 billion in assets.

On average, if this group of credit unions experienced a 30% decline in NII in a +300 bp shock, the resulting ROA would be 3 bps.

But each credit union’s business model and strategy are unique. So instead of looking at the average for this group, let’s look at the potential range of outcomes.

 Based on NCUA data as of 3Q/2016, excluding one credit union that had an exceptionally negative ROA

It is important to note that 47% of all credit unions with assets over $1 billion would have a negative ROA within 12 months if this volatility were to occur.

This enormous range of ROA, and with so many credit unions at risk of negative earnings, helps demonstrate that an interest rate risk limit along these lines could result in material risk with the unintended consequence of institutions being potentially blinded to the exposure of losses.

NEV Does Not Equal NII

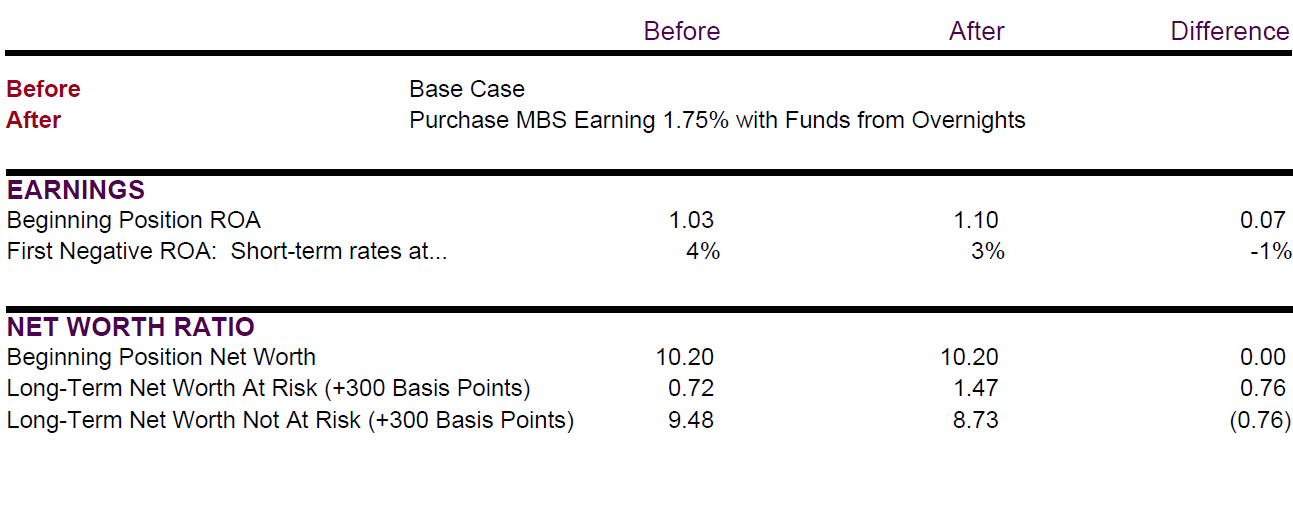
Some in the industry say that net economic value (NEV) is an indicator of future earnings. Let’s test this out by modeling a credit union taking $30 million of funds that are currently sitting in overnights earning 0.25% and investing them in mortgage-backed securities earning 1.75%. Even without a model, we know that net interest income (NII) will increase; however, as we model the scenario, we will look at both the earnings and the NEV to see how they have changed from the base case.

The income simulation results below show that the credit union will be poised for higher earnings if it purchases the MBS and will increase its interest rate risk in a rising rate environment.

Income simulation for purchasing MBS

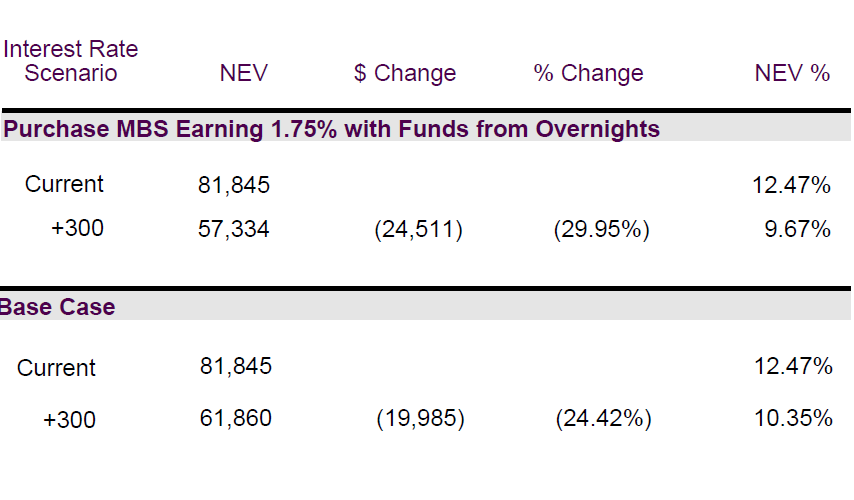
If NEV is an indicator of future earnings then one would likewise expect to see an increase in NEV in the current rate environment.  NEV results are shown below:

NEV unchanged by MBS purchase

Notice that the current NEV is unchanged. The credit union would be poised for higher earnings in the current environment if it purchased the MBS, so why didn’t the NEV increase?

Funds sitting in overnights are at par and, on the day the MBS is purchased, its purchase price is its value. In other words, $30 million sitting in overnights is worth $30 million and $30 million of MBS is worth $30 million. Therefore, the current NEV will not change.

The theory that the NEV will represent the future earnings is hard to defend and it misses key aspects of decision-making.

Some have tried to defend this concept by saying that the forward curve will predict future rates; the problem is that it has never done this consistently and has not done this at all over the last decade. If the forward curve were to accurately predict the future, the theory would indicate that the earnings of the overnights will equal the earnings of the MBS in the base rate environment. If decision-makers played this concept out, it would tell you that over time there is no reason not to have all of the credit union assets in overnights. Such a strategy doesn’t make sense.

From a business perspective, understanding the timing of earnings is one of the key questions to answer for decision-making. NEV does not help decision-makers see the timing of the earnings, nor does it answer many of the other key business questions (for more on key business questions, please refer to our c. notes titled Comparison of Interest Rate Risk Methodologies).

Is Your Risk Methodology Giving You a False Sense of Security?

,

A recent front page article in the Wall Street Journal caused quite a stir by claiming that credit unions are “piling into longer-term assets, exposing the firms to potentially significant losses if interest rates rise…”

The objective of this blog is not to debate whether there is or is not too much interest rate risk (IRR) in the industry. The facts are the facts: credit unions have operated in a historically-low rate environment for the last six years; credit unions have, on average, extended their loan and/or investment portfolios; and there has been a flight-to-safety. The ingredients are there. There is potential IRR built into the system, that, if not managed properly could present issues when rates do rise – depending on what level they rise to and how quickly. The question, then, is “is IRR being managed properly?” or are some decision-makers getting a false sense of security by IRR quantification methodologies that miss risk or allow users to assume away the risk?

In our experience of doing numerous model validations, we have seen many examples of a false sense of security being created either through the methodology or the assumptions needed for the methodology. The most common concerns that may hide risk from decision-makers include:

Traditional income simulation

  • Optimistic assumptions about growth in new business
  • Optimistic assumptions about new volume yields as rates change
  • Seldom incorporate the risk of non-maturity deposit withdrawals or member CD early withdrawals
  • Time horizon is too short, often only one year

Net economic value

  • Optimistic deposit values in current and shocked rate environments (the never-ending argument about deposit length and valuation)
  • Optimistic loan values showing large gains that ignore the market perspective on both credit concerns and liquidity risk

Risk limits

  • Policy limits that focus only on net interest income and net economic value ignoring the entire financial structure, which may hide the potential of negative net income and resulting decline in net worth

Are you at risk of being blindsided? Now is the time to evaluate your modeling methodologies and assumptions.

A/LM MODELING: NEV AND NII ASSUMPTIONS: THINGS TO CONSIDER

Market interest rates have been sitting at or near record low levels for almost five years. As a result, credit unions are booking assets at very low rates and, in many cases, lengthening their balance sheet to slow the decline in yield. From a business perspective, it makes sense for credit unions to be especially focused on their asset/liability management (A/LM) position and their understanding of risk.

In addition, the added level of interest rate risk undertaken by some institutions has not gone unnoticed from a regulatory perspective. The NCUA and state regulators have become increasingly concerned about the composition of credit union balance sheets. Interest rate risk is the most significant risk the industry faces right now, according to NCUA’s Letter to Credit Unions 14-CU-02 (Supervisory Focus for 2014). Higher levels of interest rate risk, along with increased focus, put more pressure on understanding model methodologies and assumptions.

To continue reading, please visit the article here.

Danger of Policy Limits on Net Interest Income

Establishing risk limits on only part of the financial structure is a common reason for why risks are not appropriately managed. Setting a risk limit focused on net interest income (NII) volatility does not consider the entire financial structure and can lead to bloated operating expense structures.

For example, assume a credit union has a 12-month NII volatility risk limit of -30% in a +300 environment. The table below outlines their current situation and simulated results in a +300:

The credit union performance in a +300 environment reflects a decrease in margin from 3.10% to 2.17%. This is a decrease in NII of 0.93% or a 30% decline in NII. Because of the drop in NII, ROA has now decreased from a positive 0.50% to a negative 0.43%.

The credit union is still within policy from an NII perspective but earnings decreased 0.93% and ROA is now negative in a +300 environment.

The risk of the credit union was not appropriately managed by neglecting to consider strategy levers below the margin and being overly focused on the change in risk versus the level of risk.

A board-approved policy that ignores operating expenses can lead decision-makers to take on more risk to earnings and net worth than they are truly comfortable taking.

Events

A/LM Education – Fundamentals – Full

The Fundamentals: Using A/LM as a Weapon

Recommended CPE Credit: Participants can earn up to 11.5 CPE credits

Program Description

This program provides an introduction into the fundamentals of asset and liability management (A/LM) for credit unions. Beyond an understanding of concepts necessary to address regulatory expectations, c. myers demonstrates the value of using A/LM to support effective decision-making in managing a safe and sound credit union.

The course covers the following main topics:

  • Understanding the role of government rate policy, regulation, and the broader economy on A/LM
  • Defining the characteristics of high-functioning credit unions
  • Investigating industry threats
  • Developing an understanding of risk measurement methodologies
  • Walking through case studies to demonstrate risk measurement and analysis
  • Evaluating modeling assumptions and their impact on reported results
  • Defining measures of success
  • Reviewing key policy considerations for the credit union

Learning Objectives

Our day-and-a-half flagship course addresses practical issues that credit unions struggle with daily. Like others, you’ll leave with a better grasp of the answers to questions such as:

  • What are high-functioning credit unions doing to remain relevant long term as the pace of change increases?
  • What are the five levers that contribute to ROA and how much control do we have over each one?
  • What are risk and reward trade-offs of trying to achieve a desired ROA today versus trying to protect a minimum net worth ratio for the future?
  • What does each modeling methodology tell us – or not tell us?
    • Net interest income (static and dynamic)
    • NEV (including OAS and stochastic)
    • Long-term net worth at risk
  • What are the top 10 observations from model validations?
  • What are the fundamental risks and rewards of different investments?
  • What are best practices for creating and using loan and deposit modeling assumptions?
  • What is important to know about new rules and regulations related to interest rate risk management (e.g., risk-based capital requirements)?

You’ll work in teams using case studies of real credit unions. We’ll quickly test decisions you’d consider if you were managing these credit unions and you’ll see how your decisions could change the financial performance and risk profiles of your case studies. You will leave the session better equipped to make business decisions using A/LM to evaluate those decisions.

Content level: Basic

Instructional Delivery Method: Group Live

Location: Courses are in sunny Phoenix, Arizona at our headquarters next to the South Mountain Preserve, the nation’s largest municipal park, with 51 miles of trails for hiking, biking, and horseback riding. You may even want to make a long weekend of it and visit Sedona or the Grand Canyon. We also are near several local favorites like the Desert Botanical Garden and the Phoenix Zoo.

CPE Field of Study: Finance                                               

Prerequisite Education or Experience: Basic familiarity with credit union financial statements

Advance Preparation Requirements: None

Who Should Attend: Any credit union board member, executive, manager, accountant or analyst with responsibility for understanding and/or managing asset and liability management

Fees, Refund, and Program Cancellation Policy

Fee*: $550 for one participant; $460 for each additional participant from the same credit union. Bring your entire ALCO to the same course for a flat fee of $1,535.

Refunds will not be given for cancellations received less than 30 days prior to the session; however, a substitute from your company is welcome.

In the rare case that a class must be cancelled, c. myers will make every effort to do so 30 days or more in advance of the class, in which case we are not responsible for travel costs or penalties incurred.

*Reduce your fee 15% by registering at least 30 days prior to the course.

Complaint Resolution Policy

c. myers will make every effort to resolve complaints regarding NASBA compliance within a reasonable amount of time and in a confidential manner. A formal complaint must be submitted in writing and must set forth a statement of the facts and the specific remedy sought. Submit complaints to:

c. myers corporation
Attn: CPE Program Administrator
8222 South 48th Street
Suite 275
Phoenix, AZ 85044

CPE Program Administrator: 800.238.7475

National_Registry_of_CPE_Sponsorsc. myers corporation is registered with the National Association of State Boards of Accountancy (NASBA) as a sponsor of continuing professional education on the National Registry of CPE Sponsors. State boards of accountancy have final authority on the acceptance of individual courses for CPE credit. Complaints regarding registered sponsors may be submitted to the National Registry of CPE Sponsors through its website: www.learningmarket.org.