Posts

NEV Does Not Equal NII

Some in the industry say that net economic value (NEV) is an indicator of future earnings. Let’s test this out by modeling a credit union taking $30 million of funds that are currently sitting in overnights earning 0.25% and investing them in mortgage-backed securities earning 1.75%. Even without a model, we know that net interest income (NII) will increase; however, as we model the scenario, we will look at both the earnings and the NEV to see how they have changed from the base case.

The income simulation results below show that the credit union will be poised for higher earnings if it purchases the MBS and will increase its interest rate risk in a rising rate environment.
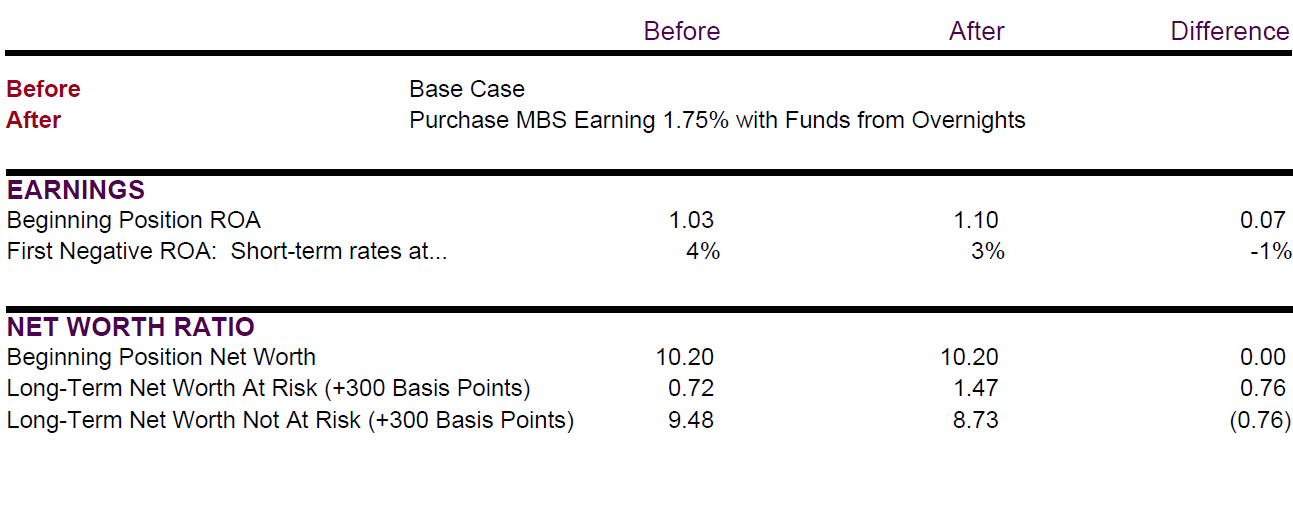
Income simulation for purchasing MBS

If NEV is an indicator of future earnings then one would likewise expect to see an increase in NEV in the current rate environment.  NEV results are shown below:
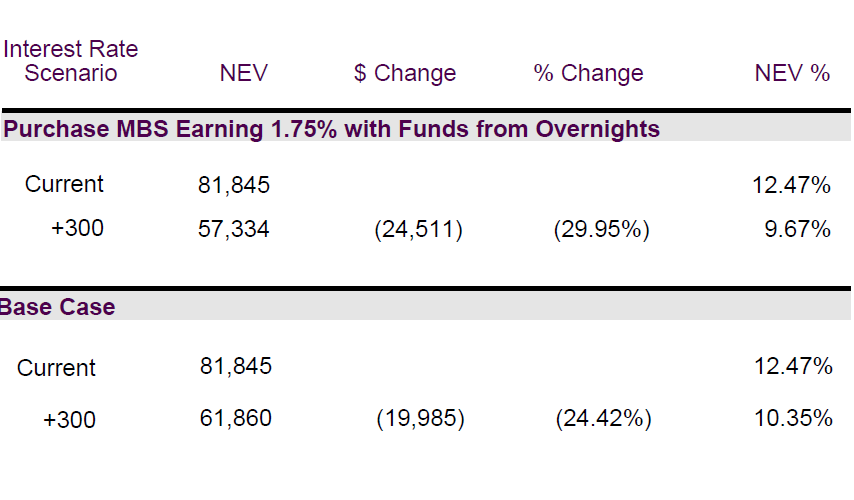
NEV unchanged by MBS purchase

Notice that the current NEV is unchanged. The credit union would be poised for higher earnings in the current environment if it purchased the MBS, so why didn’t the NEV increase?

Funds sitting in overnights are at par and, on the day the MBS is purchased, its purchase price is its value. In other words, $30 million sitting in overnights is worth $30 million and $30 million of MBS is worth $30 million. Therefore, the current NEV will not change.

The theory that the NEV will represent the future earnings is hard to defend and it misses key aspects of decision-making.

Some have tried to defend this concept by saying that the forward curve will predict future rates; the problem is that it has never done this consistently and has not done this at all over the last decade. If the forward curve were to accurately predict the future, the theory would indicate that the earnings of the overnights will equal the earnings of the MBS in the base rate environment. If decision-makers played this concept out, it would tell you that over time there is no reason not to have all of the credit union assets in overnights. Such a strategy doesn’t make sense.

From a business perspective, understanding the timing of earnings is one of the key questions to answer for decision-making. NEV does not help decision-makers see the timing of the earnings, nor does it answer many of the other key business questions (for more on key business questions, please refer to our c. notes titled Comparison of Interest Rate Risk Methodologies).

A/LM MODELING: NEV AND NII ASSUMPTIONS: THINGS TO CONSIDER

Market interest rates have been sitting at or near record low levels for almost five years. As a result, credit unions are booking assets at very low rates and, in many cases, lengthening their balance sheet to slow the decline in yield. From a business perspective, it makes sense for credit unions to be especially focused on their asset/liability management (A/LM) position and their understanding of risk.

In addition, the added level of interest rate risk undertaken by some institutions has not gone unnoticed from a regulatory perspective. The NCUA and state regulators have become increasingly concerned about the composition of credit union balance sheets. Interest rate risk is the most significant risk the industry faces right now, according to NCUA’s Letter to Credit Unions 14-CU-02 (Supervisory Focus for 2014). Higher levels of interest rate risk, along with increased focus, put more pressure on understanding model methodologies and assumptions.

To continue reading, please visit the article here.

Danger of Policy Limits on Net Interest Income

Establishing risk limits on only part of the financial structure is a common reason for why risks are not appropriately managed. Setting a risk limit focused on net interest income (NII) volatility does not consider the entire financial structure and can lead to bloated operating expense structures.

For example, assume a credit union has a 12-month NII volatility risk limit of -30% in a +300 environment. The table below outlines their current situation and simulated results in a +300:

The credit union performance in a +300 environment reflects a decrease in margin from 3.10% to 2.17%. This is a decrease in NII of 0.93% or a 30% decline in NII. Because of the drop in NII, ROA has now decreased from a positive 0.50% to a negative 0.43%.

The credit union is still within policy from an NII perspective but earnings decreased 0.93% and ROA is now negative in a +300 environment.

The risk of the credit union was not appropriately managed by neglecting to consider strategy levers below the margin and being overly focused on the change in risk versus the level of risk.

A board-approved policy that ignores operating expenses can lead decision-makers to take on more risk to earnings and net worth than they are truly comfortable taking.

Net Interest Margin and Risk Limits

A/LM measurement systems, policies and defined risk limits are intended to help ensure that credit unions do not take unacceptable risks relative to their insurance—which is net worth. While this sounds straightforward, much depends on the measurement system and policies in place.

Consider the example of a credit union that uses net interest income (NII) to manage risk and has established NII limits in policy. These types of limits are typically based on a percent volatility compared to today’s NII (click here for a related c. notes article on this topic).  By taking more credit risk, the credit union could improve their NII today—as a result of higher asset yields—thus reducing their volatility and, in some cases, putting them back within policy limits.

However, NII misses an important piece of the risk puzzle—the impact of increasing credit risk.  Recall that NII ignores any losses due to increasing credit risk since it is calculated before dealing with net operating expenses.  As a result, the credit union could be within its volatility limits yet unintentionally increase risks to net worth to unacceptable levels when accounting for credit risk.

Ultimately, the risk management process should help decision-makers understand threats to bottom-line earnings and most importantly, net worth.  Therefore, taking a comprehensive approach to taking, managing and aggregating risk is essential. This comprehensive approach should include all strategy levers—yield on assets, cost of funds, operating expense, PLL and non-interest income.

This approach also ties to the NCUA IRR Rule, which stated that “net worth is the reserve of funds available to absorb the risks of a credit union, and it is therefore the best measure against which to gauge the credit union’s risk exposure.”