Posts

Why Are My Income Simulation Results so Strong in a Shock?

,

In performing model validations for credit unions, we often see income simulation results that show significant improvement in net interest income (NII) and net income (NI) as rates rise, even for credit unions that have material positions in long-term, fixed-rate assets.  Why does this happen, and is it reasonable?

Income simulations are commonly run with a static balance sheet, in which the asset and liability mix remains constant regardless of the rate environment, and loan yields are often assumed to move in lock step with market rates.  However, this approach can lead to simulations calculating material returns on new business and increases in margins as rates rise.
The example below illustrates why this often happens.  The calculations assume an average industry loan-to-asset ratio; yield on loans, yield on investments, cost of funds and net operating expense continues into the future, shown for both the base rate environment and the up 300:
In the base rate environment, the new business calculation above is producing an ROA of 0.80%, roughly in line with the current ROA for the industry.  Said differently, if rates do not change the new business would be neither helping nor hurting NII or NI.  However, if you incorporate typical new business assumptions in an income simulation utilizing a static balance sheet, the new business ROA for the up 300 rate environment is 2.30%, a 150 basis point (bp) increase over the new business ROA for the base rate environment.
Combining a 2.30% new business ROA with the earnings on existing business helps explain why NII and NI results often improve as rates rise, even if the ROA on existing business is decreasing.  However, does a 2.30% new business ROA in a +300 bp rate environment pass the reasonableness test?
Consider the implication; this infers that if rates go up 300 bps, over time the entire industry would earn over 200 bps, more than double any peak the industry has experienced.  Following this logic, a +500 bp rate change would show an ROA exceeding 3.00%.
The purpose of ALM/interest rate risk analysis is to understand risks, not ideal situations.  What are risks that could cause earnings to not be this good?
  • What if our deposit mix becomes more heavily weighted toward member CDs as rates rise? In the largest credit union peer group, the last time rates went up, Reg Shares+Share Drafts dropped from 43% of funds to 33%; currently the ratio is 45%. When rates were higher, CDs were the largest deposit type, costing credit unions much more than non-maturity deposits. Does your base analysis incorporate members shifting funds like they did in the past?
  • What if loan yields don’t move at 100% of the market? Competition to generate loans can often lead to irrational pricing.  It is reasonable to expect that competition for loans may restrict the ability for institutions to move loan rates up 100% of the rate change.
  • What if our loan-to-asset ratio is pressured as rates rise?  Rates don’t only go up due to a thriving economy; the material drop in loan-to-asset ratios over the last five years has squeezed margins.  Lending has picked up over the last year, but there is no guarantee that loan-to-asset ratios can’t drop again.
The earnings on the new business would most likely still be positive in the 300 bps shock, but would be significantly lower than the default assumption.  These are real risks that can greatly impact earnings and need to be incorporated in the base risk analysis.  The exposure to risk should then be compared against policy limits for ALCO to understand the risks being taken.  Beyond the base case the stress of additional pressure should also be tested.

When is Worst Case?

, ,

In risk analysis, it is important to make realistic assumptions about potential bad scenarios that could play out—large increases in interest rates and credit risk exceeding expectations are just a couple that come to mind.

While interest rates are at an all-time low, credit risk is at an all-time high for some credit unions. In preparing for your future, don’t mistake an all-time high with worst case.

For example: back in August 2007, the Associated Press reported that foreclosure filings had soared 93% from July 2006 to July 2007 and that the national foreclosure rate stood at 1 filing for every 693 households. Then in the first quarter 2008, CNN reported that, according to the Mortgage Bankers Association, the number of homes in foreclosure had topped 1 million.

Given this unprecedented level of foreclosure activity, it certainly felt like it couldn’t get any worse. However, according to RealtyTrac’s 2009 year-end report on foreclosures, there were over 2.8 million homes, or 1 in 45 households, with foreclosure filings in 2009 alone.

The bottom line is that, in risk planning, it can be very dangerous to assume that just because things are bad they can’t get any worse. It is important for your management team and board to understand the potential impact on your operations if things do get worse. It is likewise important for you to have well thought out plans—today—as to how you will pull your strategic levers to manage your credit union through even rougher times.

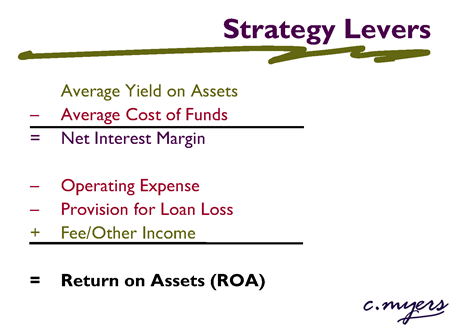
strategy levers

Hope for the best, but plan for the worst… or at least minimally prepare for the worst.