Posts

30-Year Fixed-Rate Mortgages vs. 5/5 ARMs

Recently, we’ve seen more credit unions offering a 5/5 ARM product. While there are some differences institution-to-institution, usually the 5/5 ARM repricing characteristics have a 2% initial cap, a 2% annual cap and a lifetime maximum rate adjustment of 5% above the initial interest rate. The intent is to offer a product that is beneficial for the member by having a lower initial rate and smaller rate adjustments throughout the life of the loan due to the initial cap. As a side benefit, 5/5 ARMs are assumed to have less risk than a 30-year mortgage in a rising rate environment.

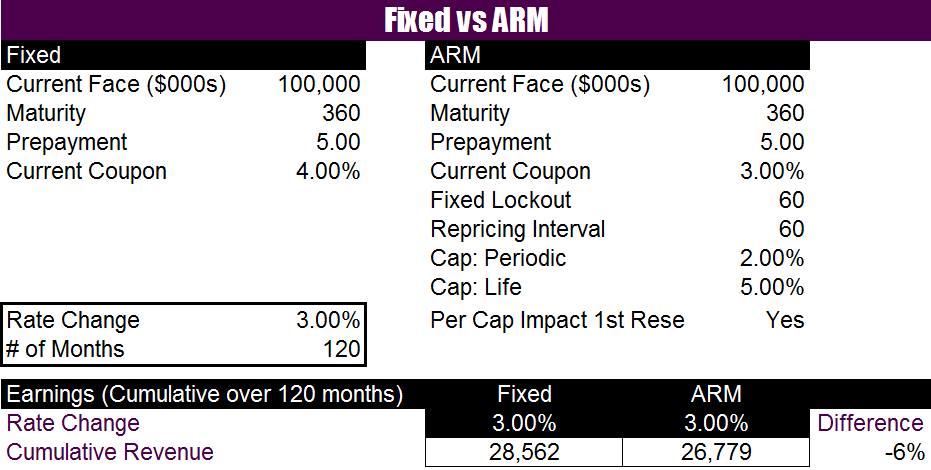
Let’s evaluate the 30-year mortgages and 5/5 ARMs from a business perspective over a 10-year period. The example below compares the earnings of a 30-year mortgage with a 4% rate to a 5/5 ARM with a 3% rate and the repricing characteristics described above in a +300 rate environment.

Fixed vs ARM Example

Over the course of 10 years, the 5/5 ARMs will not earn as much as the 30-year fixed mortgage. The 5/5 ARMs will certainly earn more in years 6 through 10 due to the higher rate, but that is not enough to offset the first 5 years of lower income compared to the 30-year mortgage. Eventually, the 5/5 ARMs will earn more than the 30-year mortgages; however, the breakeven point is not until about 12.5 years.

The 5/5 ARMs can be an additional product to offer members as a giveback. The key is to understand the trade-offs of such a product and how it fits with the credit union’s strategy.

Risk/Return Trade-Off—Part II

In last week’s blog, we discussed the need to understand risk/return trade-offs and the concern in relying solely on net economic value (NEV) for decision-making. If the objective is to decrease NEV volatility and your strategy under consideration is to A) Sell 30-year mortgages or B) Sell a 3-year bullet, does NEV fairly represent the downside of this sale? The answer is “no” and we will explain with an example.

To keep the math simple, assume we have $100M in both recently originated 30-year mortgages and 3-year bullets. In evaluating the decision using only NEV, it is clear the answer is to sell the 30-year mortgages because they devalue the most in a +300 basis point (bp) rate shock, as shown below:

However, the analysis should not stop there. Consider the potential impact to earnings of holding $100M in each product versus holding that same balance in overnight funds. Over 12 months, the credit union is giving up $4M in revenue by selling the 30-year mortgages compared to $550K by selling the 3-year bullet.

There are different ways to incorporate the return component when evaluating strategies. In this approach, divide the 12-month revenue difference by the market value loss in a +300 bp shock to get the trade-off ratio.

The trade-off ratio reflects the foregone revenue associated with mitigating the NEV volatility. The smaller the ratio, the lower the revenue sacrifice per dollar of shocked value reduction. In this example, selling mortgages gives up revenue that equals 20% of the risk, while the bullet gives up only 6% of the risk. Said differently, the credit union could get more “bang for its buck” by selling assets with a lower ratio.

The objective here is to demonstrate that seeing only the change in NEV without seeing the change in return can result in misleading decision information. A tool or model that shows the impact to earnings is a critical piece of the decision-making. If you take this one step further and incorporate longer-term risk to earnings, the decision information becomes even stronger.