Posts

Investment Strategy: Consider Income Volatility vs. Yield

Increase in loan-to-asset ratios along with the potential for higher market interest rates and tighter liquidity heighten the importance of the investment strategy and its role in supporting a credit union’s overall business strategy.

Understanding income volatility versus yield can be valuable in establishing investment strategy. Below we are illustrating the point using two investment strategies with similar yields while exploring volatility in various rate increases. This concept can also be applied to individual investments.

The illustration below complements concepts featured in the February 23rd blog, Don’t Just Focus on Interest Rate Risk – Yield Matters.

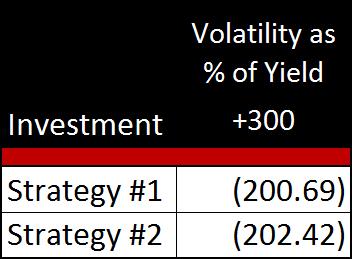
Again both investment strategies have essentially the same yield today. Additionally, they have very similar income volatility as a percent of yield in a +300 rate environment.

17-03dav1

At this point, when deciding between the two strategies the credit union would view the decision as a coin flip or slightly tilted to Investment Strategy #1.

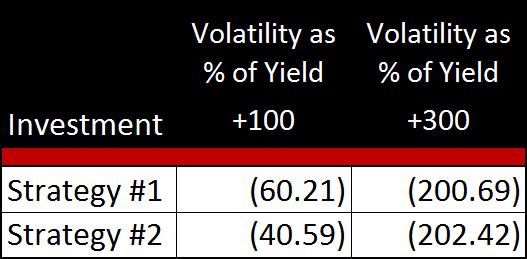
But let’s not stop there. Every credit union has a unique appetite for risk and expectation for rates. Beyond evaluating risk in a +300, if a credit union is focused on a +100 bp increase in rates, then they would also want to evaluate the risk/return relationship in a +100 rate environment.

17-03dav2

Considering the risk/return trade-off is similar in a +300, but Investment Strategy #2 has less volatility if rates increase 100 basis points, the credit union would determine that Investment Strategy #2 is a better fit overall.

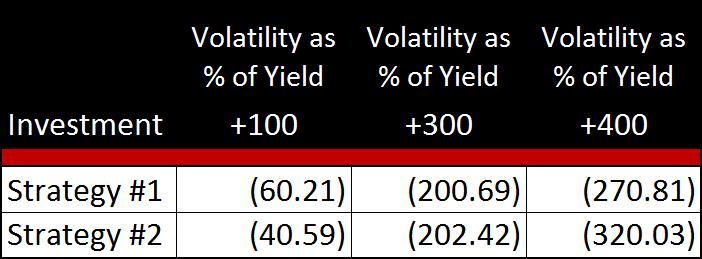
For many credit unions, looking beyond a +300 rate change is an important part of the risk management process, especially considering that a +400 rate environment today could be the +300 rate environment in the near future. Understanding risk and risk/return relationships beyond +300 is good practice.

17-03dav3

If the credit union is actively managing risk through +400, the risk/return relationship shows Investment Strategy #1 to be the best fit.

Creating a table that provides the risk/return relationships for a wide range of rate scenarios can provide better clarity in connecting the investment strategy with the credit union’s overall strategy and appetite for risk.

17-03dav4

Keep in mind there is no “right” answer. What is important is to help key stakeholders easily see the trade-offs.

Don’t Just Focus On Interest Rate Risk – Yield Matters

,

While interest rates have been fluctuating over the last few months, some feel rates will consistently begin to move up based on indications from the Fed. But what if they don’t? As you discuss your earnings and interest rate risk, it is important to not just look at the risk. Credit unions should pull it all together and look at the overall risk/return trade-offs, because yield does matter.

Take, for example, the two assets shown below.  Mortgages are considered to carry a relatively high potential for interest rate risk, and for good reason.  Mortgages can increase a credit union’s interest rate risk. The column labeled “% NI impact vs Assets” displays the relative risk of each asset to the average risk of the institution.

The baseline in this report is 100%.  If an asset class shows more than 100%, it carries more interest rate risk than the average risk of the institution.  If an asset class shows less than 100%, it carries less interest rate risk than the average risk of the institution.

In this example, the 1st Mortgages have risk equal to about 160% of the credit union’s average risk, while the Callable Step Up has risk equal to about 120% of the credit union’s average risk.  For this credit union, then, 1st Mortgages have more relative interest rate risk than the Callable Step Up.

But understanding the risk is only a piece of the picture.  Yield relative to risk certainly does matter.

The last column – “Volatility % of Yield” – relates the risk of the asset to its yield:  the risk/return trade-off.  It is this last analysis that lets the credit union see that all risk is not created equal.

The interest rate risk of the Callable Step Up is about 197% of its yield, whereas 1st Mortgages have risk of about 77% of its yield.  The interpretation of this is that while the Callable Step Up carries relatively less risk for this credit union’s structure, the 1st Mortgages represent the better risk/return trade-off.

17-02-buz-blog-irr-yield-matters

The objective of this example is not to say that mortgages are always a better risk/return trade-off than Callable Step Ups or to suggest that credit unions should load up on mortgages.  The objective is that in areas where you feel your credit union may be able to take on more risk, why not understand where you are able to get the best risk/return trade-offs?  We wrote a c. notes on this topic in 2016.