Get Them While They Are Young
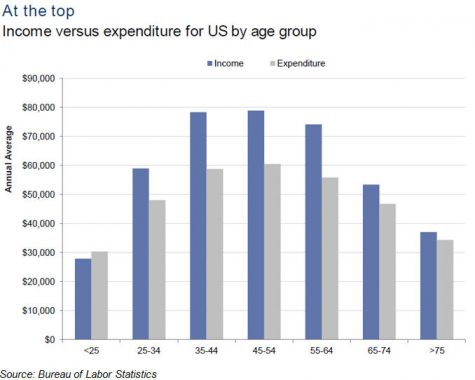
So often, credit unions focus on attracting younger members in their 20s. The intent is to make them lifelong members so the credit union can benefit when those members are older and ready to borrow. This idea makes sense when considering how consumers’ income and expenditures increase as they age, particularly in what is considered the prime borrowing years of 30 to 50 years old.

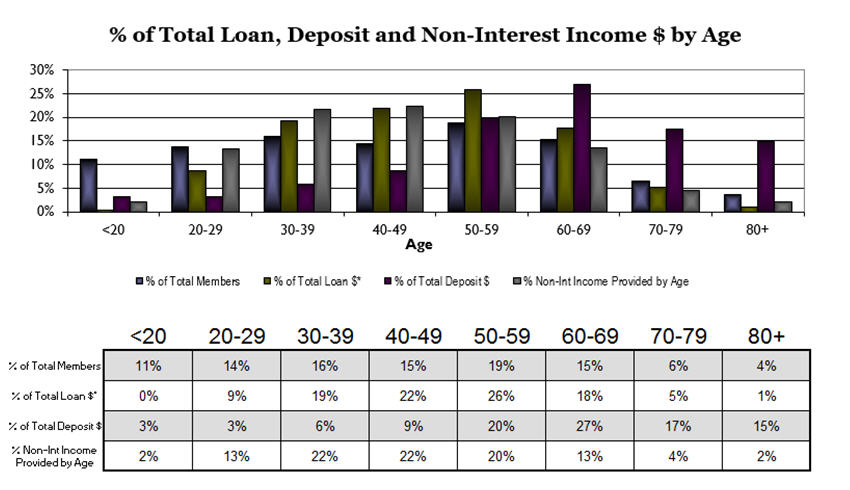
While the idea may make sense, there are some questions on the approach. Let us start by taking a look at some numbers. The graph and chart below represent a composite of the demographic data we have gathered from strategic planning sessions we facilitate.

It is no surprise that as members move into their 30s and 40s, the balance of loans they hold increases because they buy houses and more expensive cars. What surprises most credit unions, however, are the loan balances members still have in their 50s, and especially in their 60s. In fact, the 60-year-olds are on par from a lending standpoint as the 30-year-olds and this is not just because of higher balance mortgage loans. For those in their 60s, auto loans continue to be a major component of that age group’s borrowing.
Let’s circle back to the members under 30. They account for 25% of the membership, yet only 9% of the loan dollars and 6% of the deposits. Even taking non-interest income into account, which is usually thought to be the area in which younger members shine, they punch below their weight. Overall, these members do not contribute very much compared the other age brackets. While this may be expected, there are some questions to consider:
- What types of resources are being spent to attract, retain, and service these members? At 25%, they are a sizable portion of the overall membership.
- How long will they have to be members before they become profitable, contributing members to the co-op, making up for the resources spent to retain and service them until then?
- Does the average length of membership of 30- and 40-year-olds support the idea of 20- year-olds becoming lifelong members?
- Does that average length of membership also line up with the number of years it takes for those in their 20s to become profitable members?
The average length of membership for those in their 30s tends to be 5 to 7 years and 7 to 9 years in their 40s, suggesting that most 20-year-olds do not become lifelong members. Furthermore, some credit unions that track this information regularly have seen as much as one-third of young people leave the credit union when they turn 18.
Lining up these numbers with the competition from niche market players (think FinTechs) that are providing one-off services, getting them while they are young is harder and harder to do. Ultimately, credit unions have to ask the question of how many resources are they willing to commit on members that may not be with the credit union long enough to be profitable, especially when there may be more opportunities in other areas of the membership.

