Posts

Borrowing Trends are Changing…

,

Would you be surprised by who is actually borrowing from your credit union, or applying for loans?  A recent article in the Wall Street Journal (WSJ) noted the growing trend of baby boomers moving into their retirement years completely unprepared from a financial perspective.

The article states that “people in the U.S. ages 65 to 74 hold more than five times the borrowing obligations Americans their age held two decades ago.”  In addition, median savings has decreased 32% in the last 10 years for those people nearest retirement age.  The result is that many Americans who should be enjoying retirement will work longer in life, and continue to borrow.

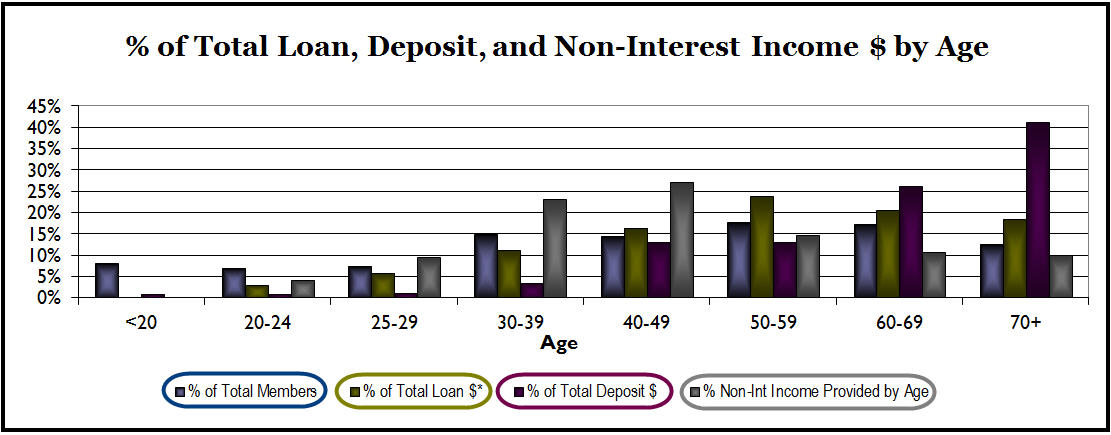
C. myers facilitates over 130 strategy sessions per year, and the data collected from those sessions lines up with the observations noted in the WSJ article. The image below is sample member demographic data for a credit union with more than $1 billion in assets as of June 2016.

If you focus on the two middle columns within each age bracket (loans and deposits) a couple of things stand out.  The data shows that while members over the age of 60 do hold about 67% of this credit union’s deposits, that same age demographic also holds about 40% of the credit union’s total loans.  This was a big surprise to this particular credit union.  They had not realized that their loan portfolio was that skewed toward these age segments.  This uncovered the possibilities of additional opportunities and considerations.

17-03-mac-0329

If Americans who traditionally would have been in their retirement years continue to remain in the workforce and remain active borrowers, what can this mean for your credit union?  A few questions to consider include:

  • How well do you know your numbers?  For example, what percent of loan dollars are held by each relevant age segment?  How many new loans have been generated by these age groups in the last 1-3 years?
  • How do you determine if your credit union has a good handle on the needs and wants of the 60 and up age segment of your membership?
  • What unique credit risk characteristics, if any, need to be considered?
  • What does your credit union do to specifically market loans to this group?

Many credit unions are surprised to learn that this age group contributes so significantly to the credit union.  As a result, they have put less effort or resources into cultivating these opportunities.  For many, this discovery represents a chance to not only grow loans, but better serve this segment of the market.  Is your credit union ready to capitalize on the changing needs and wants of this generation?


Get Them While They Are Young

,

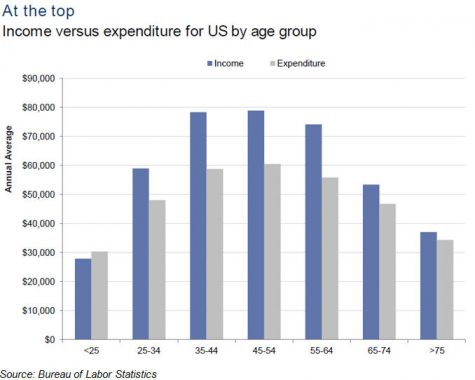
So often, credit unions focus on attracting younger members in their 20s.  The intent is to make them lifelong members so the credit union can benefit when those members are older and ready to borrow.  This idea makes sense when considering how consumers’ income and expenditures increase as they age, particularly in what is considered the prime borrowing years of 30 to 50 years old.

bls-income-vs-expenditure-for-us-by-age-group

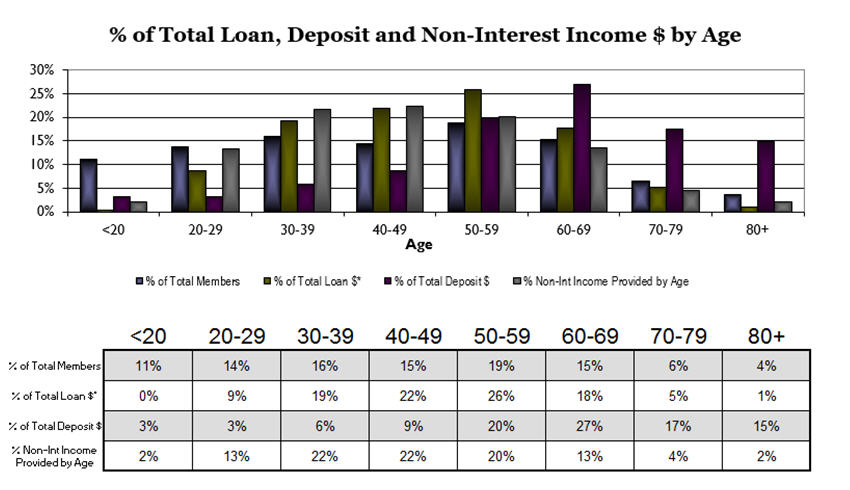
While the idea may make sense, there are some questions on the approach.  Let us start by taking a look at some numbers.  The graph and chart below represent a composite of the demographic data we have gathered from strategic planning sessions we facilitate.

total-loan-deposit-and-non-interest-income-by-age

It is no surprise that as members move into their 30s and 40s, the balance of loans they hold increases because they buy houses and more expensive cars.  What surprises most credit unions, however, are the loan balances members still have in their 50s, and especially in their 60s.  In fact, the 60-year-olds are on par from a lending standpoint as the 30-year-olds and this is not just because of higher balance mortgage loans.  For those in their 60s, auto loans continue to be a major component of that age group’s borrowing.

Let’s circle back to the members under 30.  They account for 25% of the membership, yet only 9% of the loan dollars and 6% of the deposits.  Even taking non-interest income into account, which is usually thought to be the area in which younger members shine, they punch below their weight.  Overall, these members do not contribute very much compared the other age brackets.  While this may be expected, there are some questions to consider:

  • What types of resources are being spent to attract, retain, and service these members? At 25%, they are a sizable portion of the overall membership.
  • How long will they have to be members before they become profitable, contributing members to the co-op, making up for the resources spent to retain and service them until then?
  • Does the average length of membership of 30- and 40-year-olds support the idea of 20- year-olds becoming lifelong members?
  • Does that average length of membership also line up with the number of years it takes for those in their 20s to become profitable members?

The average length of membership for those in their 30s tends to be 5 to 7 years and 7 to 9 years in their 40s, suggesting that most 20-year-olds do not become lifelong members.  Furthermore, some credit unions that track this information regularly have seen as much as  one-third of young people leave the credit union when they turn 18.

Lining up these numbers with the competition from niche market players (think FinTechs) that are providing one-off services, getting them while they are young is harder and harder to do. Ultimately, credit unions have to ask the question of how many resources are they willing to commit on members that may not be with the credit union long enough to be profitable, especially when there may be more opportunities in other areas of the membership.

Concentration Risk in Non-Interest Income?

NCUA cited the Basel Committee on Banking Supervision when defining concentration risk in NCUA Supervisory Letter – Concentration Risk:

“A risk concentration is any single exposure or group of exposures with the potential to produce losses large enough (relative to capital, total assets, or overall risk level) to threaten a financial institution’s health or ability to maintain its core operations.”

In evaluating the level of concentration risk present in a credit union’s financial structure, many approaches – including the current risk-based capital proposal – operate under the assumption that the material risk to net worth resides in the asset structure of the balance sheet. Managing concentration risk by setting limits on only the balance sheet components of a credit union’s structure falls far short of addressing risk concentrations – which is any exposure that could threaten the ability of a credit union to continue “business as usual.” A reliance on non-interest income to generate earnings may expose many credit unions to the potential for large losses.

In our experience working with hundreds of credit unions, a significant portion of non-interest income (often well in excess of 50%) is derived from interchange revenue, overdraft/courtesy pay and mortgage origination/gains on sale. Even though some battles over interchange income have settled, the risk of non-interest income dropping materially in the future still remains. Consider the impact to earnings and net worth if courtesy pay/overdraft income is considerably altered in the name of consumer protection or if mortgage originations continue their sharp decline.

While the most recent economic downturn was certainly driven by asset-based credit risk exposures, an effective concentration risk management process, and (even more importantly) an effective aggregate risk management process, should include an evaluation of any material exposure that could threaten net worth. Because the ability of a credit union to raise and maintain capital levels is directly related to its ability to generate earnings, any exposure that materially impacts earnings could adversely impact capital levels. Concentration risk policies and procedures that overlook the impact of threats to non-interest income sources may lack a key component to addressing all material threats to net worth.

Fed Indication on Bond Buying

On June 19, Chairman Ben Bernanke indicated that the Fed may slow its bond purchases later this year. Since that statement, the 10-year Treasury yield has increased 35bps from 2.20% on Tuesday, 6/18, to 2.55% on Wednesday, 6/26 (Treasury.gov), while the Dow Jones Industrial Average (DJIA) has dropped 408 points over the same period (Bloomberg.com). Keep in mind, the Fed only made a statement.

This raises some interesting questions for decision makers to consider, including:

If the rate increase is sustained…

  • How might this impact loan volumes in the short and intermediate term? Could volumes increase in the short-term for fear of loan rates increasing? What impact would it have on longer-term loan demand?
  • How might non-interest income be impacted?
  • If you were counting on your callable bonds to be called, and now they may not be called, should you hold them or fold them?
  • Could you experience another flight to safety if the stock market continues to be volatile?

Treasury rates could come back down and the stock market will hopefully “right” itself at some point. Nonetheless, decision makers should consider the impact to financial performance if current trends continue. Running through different “what-if” scenarios of how the institution would react and testing them in forecasting and risk models can help decision makers be better prepared.

Net Interest Margin and Risk Limits

A/LM measurement systems, policies and defined risk limits are intended to help ensure that credit unions do not take unacceptable risks relative to their insurance—which is net worth. While this sounds straightforward, much depends on the measurement system and policies in place.

Consider the example of a credit union that uses net interest income (NII) to manage risk and has established NII limits in policy. These types of limits are typically based on a percent volatility compared to today’s NII (click here for a related c. notes article on this topic).  By taking more credit risk, the credit union could improve their NII today—as a result of higher asset yields—thus reducing their volatility and, in some cases, putting them back within policy limits.

However, NII misses an important piece of the risk puzzle—the impact of increasing credit risk.  Recall that NII ignores any losses due to increasing credit risk since it is calculated before dealing with net operating expenses.  As a result, the credit union could be within its volatility limits yet unintentionally increase risks to net worth to unacceptable levels when accounting for credit risk.

Ultimately, the risk management process should help decision-makers understand threats to bottom-line earnings and most importantly, net worth.  Therefore, taking a comprehensive approach to taking, managing and aggregating risk is essential. This comprehensive approach should include all strategy levers—yield on assets, cost of funds, operating expense, PLL and non-interest income.

This approach also ties to the NCUA IRR Rule, which stated that “net worth is the reserve of funds available to absorb the risks of a credit union, and it is therefore the best measure against which to gauge the credit union’s risk exposure.”