Posts

Observations from ALM Model Validations: Extremely Profitable New Business ROA in Static Balance Sheet Simulations

In this installment of our series on observations from model validations, we’ll focus in on the results from traditional income simulations, specifically static balance sheet simulations. We often see results that show low risk despite the credit union having a material amount of fixed-rate, long-term assets.

Take the example below which shows the NII results from a static balance sheet simulation. In year 1, the NII volatility is -15.62% in a +300 bp rate environment, which would be considered lower risk, and year 2 is even better at -8.45%. Keep in mind most policies have NII volatility limits of 20-30%, so this particular credit union looks pretty good. But why?
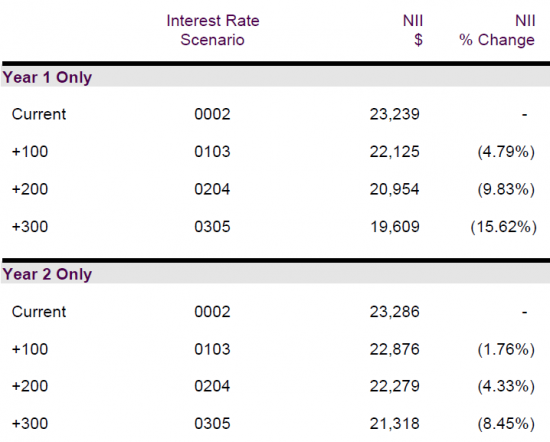
Static balance sheet showing NII volatility
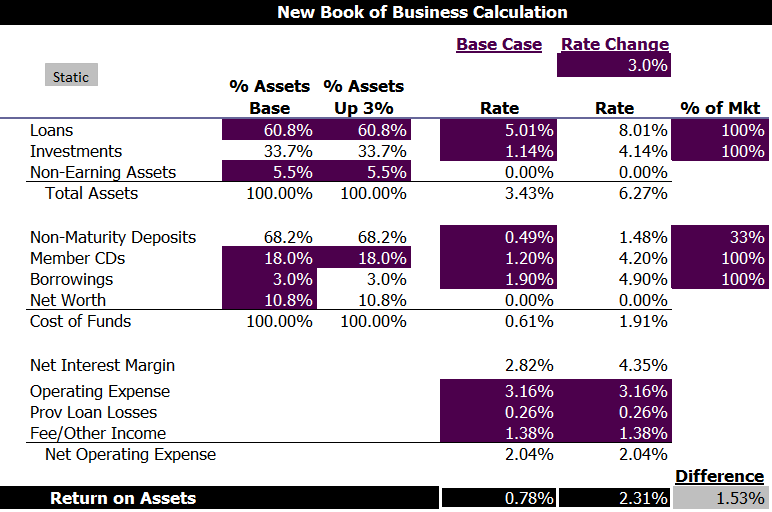
While there could be a number of reasons, what we’ve found is that static balance sheet simulations assume the new business will always be extremely profitable if rates increase. The example below shows a credit union that has a base case ROA of 0.78% that jumps 153 bps to 2.31% in a +300 rate environment.

Static balance sheet simulation with new business ROA over 2{f36f94659acab79cca6adb0c2cb87abd9a89960d2b05b787f21b160005154717}

As we discussed in a previous blog, Observations from ALM Model Validations: Cost of Funds Back Testing, static balance sheet simulations assume that the deposit mix will not change as rates change, even though history suggests otherwise. It also generally assumes that a credit union could never have the loan-to-asset ratio drop, and often assumes the institution will be able to raise its loan rates 100% of the rate change.

Clearly, relying on a new business ROA north of 2% is not reasonable. These unrealistic assumptions about new business understate the risk of an institution.

Often when presented with this evidence, the response is that there is no way that such a high ROA is being assumed because the results show a decline in ROA for the first year (see example below). The reason is that often places only look out one year, maybe two. So the new business impacts the results but is smaller than the existing business.

To prove this out, look out at year 5 in your static simulation. You may not fully see the ROA over 2%, since most institutions are having the strain from their existing commitments holding the ROA back, but it is likely you will see an ROA that is above a level the credit union has ever experienced. If you want to see an even less defendable answer, look out at year 5 for a +500, and you will most likely see an ROA that far exceeds the earnings experienced the last time rates were at 5% (2006-2007).
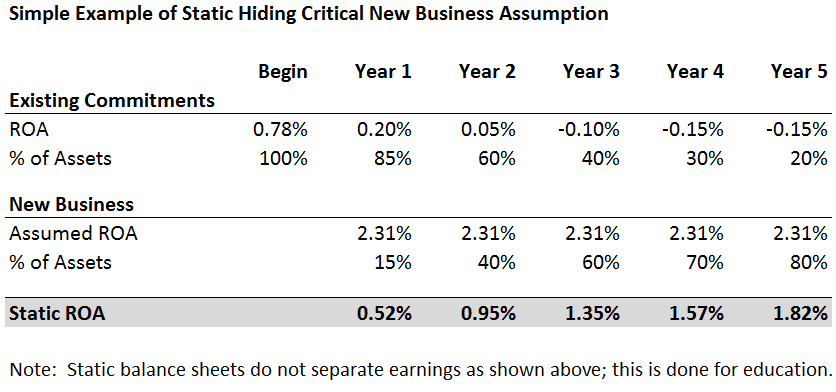
Static balance sheet hiding critical new business assumption

Seeing results from this perspective, it is hard to call a static balance sheet a risk simulation.

How is Your Modeling Positioned to Capture NCUA’s “Chief Concern”?

In the most recent NCUA Economic Update, John Worth (Chief Economist, NCUA) outlined NCUA’s chief concern regarding the impact of a changing rate environment, given an interpretation of recent Federal Reserve comments and data analysis. See below for a key quote from the video:

“If the increase in short rates is larger than the increase in loan rates, that is if the yield curve becomes flatter, credit unions could likely see a narrowing of net interest margins. We have already noted that non-interest income has moved lower recently. If that trend continues while net interest margins are also shrinking, many credit unions will face declining net income or even losses. Here at NCUA, our chief concern is that credit unions are aware and prepared for this possibility. Credit unions should have a firm idea of how their income statements and balance sheets are affected by a rapid rise in short-term rates, and they should have a plan for dealing with the potential consequences [emphasis added].”

Credit unions that rely on static balance sheet measures of non-interest income volatility, net economic value simulations and parallel rate changes will miss the impact on their financial structures of NCUA’s chief concern – the simultaneous impacts of a compressed net interest margin and a decline in non-interest income. As conventional methods of risk management lack the ability to quantify this key risk, credit unions using such methods must turn instead to their budgeting process. However, does the current budget process enable “what-if” scenario analysis that can incorporate the possibility of rising short-term rates? Said differently, how could your credit union’s earnings and financial structure change if cost of funds increases and new asset yields remain stagnant, thus further compressing already historically low net interest margins?

Understanding the possible impacts to planned strategies in the event rates begin changing in 2015 would add valuable information to the decision-making process. Let’s say a budget “what-if” includes a rate change and margin increase through lagged deposit pricing assumptions and aggressive movements in loan and investment portfolio new volume rates. The impact on the base budget in this “what-if” should be fairly clear – earnings increase. This is especially true if such a change in rates does nothing to alter assumptions regarding consumer behavior (i.e., projected loan volumes and deposit funding mix from the base budget do not change).

Management teams should include an analysis of the impact on earnings and financial structures from an increase in short-term rates only, leaving long-term rates flat, in their budget “what-ifs” (projections) and scenario analysis. This is especially important if the risk management tool utilized in the A/LM process lacks the ability to inform the credit union of this risk.

Isolating Interest Rate Risk with a Static Balance Sheet

,

Some will say that a static balance sheet income simulation achieves its objective of isolating interest rate risk by reducing the variables in the simulation. The question then is: What risk should be isolated?

  • Interest rates change and cash flows do not change
  • Interest rates change and cash flows change in response

If the answer is A:

  • Callable bonds would still be called as rates increase
  • CMO/MBS cash flow assumptions wouldn’t extend
  • Prepayment assumptions wouldn’t slow as rates increase
  • Deposit balances wouldn’t migrate to higher cost deposits (such as CDs) or reverse their flight to safety

Note that holding these assumptions constant would result in less “moving pieces” but would disregard material features of interest rate risk. The answer must be B.

Regulators state that assumptions in modeling should be “reasonable and supportable.” History has demonstrated that ignoring the extension of asset cash flows is neither reasonable nor supportable.

If it is obvious that asset behavior must change, why then isn’t it obvious that the risk of changing deposit behaviors must also be included? Does history support the assumption that the deposit mix will not change as rates change?

Below is the distribution of regular shares and share drafts for NCUA’s largest peer group (credit unions >$500M in assets).

History proves that assuming low-cost deposits will not change as rates change is neither reasonable nor supportable.

There has been a lot of discussion on the need to analyze non-maturity deposit behavior and to understand the threat of surge deposits. Assuming that deposit behavior remains constant (static) while interest rates are changing does not capture the threat of surge deposits leaving. Why analyze this exposure and then ignore this risk in an income simulation?

Sometimes the reason given for ignoring this risk is for simplicity or comparability. However, if A/LM models were not sophisticated enough to factor in prepayment assumptions, in the name of simplicity and comparability, they would be considered unacceptable. In order to incorporate the exposure on the liability side of the balance sheet, the sophistication of modeling needs to be increased.

Proposed IRR Regulation Could Have Unintended Consequences

C. myers agrees with the objective that most institutions should have an effective interest rate risk (IRR) management policy supported by an effective IRR program.  However, we do not agree that it should be regulation.

Keep in mind as you read our comments that our business is to provide asset/liability management services to financial institutions.  We have worked with hundreds of credit unions providing long-term risks to earnings and net worth simulations, static and dynamic balance sheet analyses and net economic value (NEV) simulations.  A regulation of this nature would likely materially increase our business opportunities, yet we do not believe it is in the best, long-term interest of the industry.

One primary reason that we do not support the proposed regulation is that it is ambiguous.  We understand this ambiguity is necessary.  However, ambiguity will lead to subjectivity when implementing the regulation.  Whether a credit union has a written policy with adequate limits and an effective program addressing IRR may ultimately be determined by each credit union’s most recent examiner.

Please click here to read our full response to the proposed IRR regulation.

Static Income Simulation – Things To Consider

One of the traditional approaches to income simulation is to use a static balance sheet, which assumes that a credit union’s mix of assets and liabilities remains constant, regardless of external forces.  In other words, static analysis assumes that every dollar of mortgages that matures is immediately put back into a new mortgage at the current market rate.  It also assumes that the deposit mix of the credit union never changes.

While it may sound simple and straightforward enough to just assume the balance sheet structure never changes, these assumptions about new business can be very misleading.  Would you expect mortgage volumes to remain the same if rates increase 300 bps?  Would you expect to maintain the same percentage of your funding in low-cost regular shares if rates increase 300 bps?  The answer to both these questions is, of course, “it’s not likely.”

If you are doing static analysis at your credit union, consider running alternate scenarios slowing mortgage volumes if rates increase.  Also consider increasing member CDs to the levels you experienced as rates were increasing from 2004 to 2006.  These simple-to-run scenarios will likely give you a better picture of your risk to earnings and net worth in a rising rate environment.

Finally, the yield curve we are experiencing today is extremely steep.  We recommend that you also test out scenarios where the yield curve flattens to a more historical level of about 150 bps.  Remember, in 2003-2004 we also experienced a very steep yield curve.  However, when the Fed started raising short-term rates in 2004, long-term rates did not increase by much, flattening the yield curve.