Posts

Strategic Questions around Indirect Auto Lending and Member Growth

,

How does your credit union define success when it comes to growth?  For some credit unions it might be asset growth, growth in loans, or growth in membership.  If one of your credit union’s key strategic objectives is growing membership, having the business intelligence to understand where new members are coming from becomes important.  This blog will focus on strategic questions to consider regarding the impact of new member growth through indirect channels.

Couple reviewing car loan information while shopping for a new car at automotive dealership.

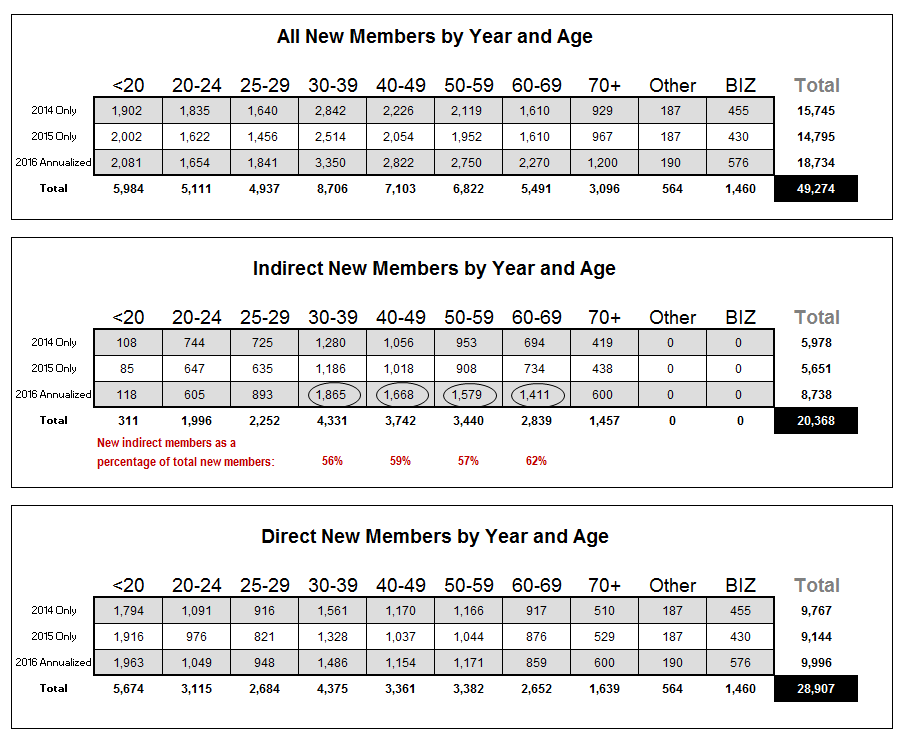
For many credit unions, a large percentage of membership growth in recent years has been driven by indirect members. The credit union demographic data noted below shows that between ages 30-70, the years when members do most of their borrowing, more than 50% of the total growth in members in 2016 came through the indirect channel (see the highlighted line in the second table). This information is noteworthy because this credit union has a strategic objective of deepening relationships with members as measured by products per member, and growth in indirect members may be at odds with that objective.

Tables breaking new direct and indirect credit union members by year & age

Growing indirect members is not necessarily a bad thing – in many ways the growth can be positive if the growth in members (and therefore loans) is managed appropriately.  The key is to answer strategic questions and gain clarity on how indirect member growth impacts the credit union and its metrics.

Some strategic questions to consider:

  • How does growth in indirect members impact metrics such as products per member, and is growth from indirect members segregated appropriately when looking at metrics?  Increasing products per member would be significantly impacted by a majority of new member growth coming through the indirect channel.
  • How do new indirect members fit within the description of the credit union’s desired target market(s)?
  • How does indirect member growth support the long-term sustainability and strategy of the credit union?
  • What is the credit union doing to market other products to the indirect members, and has it been effective?
  • How many hours and dollars are spent trying to get those new indirect members to do additional business with the credit union?  Can you quantify if those investments are paying off?
  • How many indirect loans are actually made to current members versus non-members?
  • If the credit union slows indirect growth for strategic reasons, or if auto sales slow, how will that be accounted for with respect to goals of membership growth, products per member, or other metrics?
  • How does fast growth in indirect auto loans impact cross-selling opportunities with indirect members, or with the rest of the membership?
  • Does indirect member growth create a false sense of security in metrics such as membership growth or loan growth?

Test driving some of the asset/liability management implications can be a good exercise as well. For example, if your credit union is heavily reliant on indirect auto lending to sustain the business model, imagine a scenario where market rates for deposits begin to rise. If your credit union has to increase deposit rates in order to maintain liquidity, can rates on indirect autos be increased enough to maintain margins given the competition for indirect lending in your market(s)? If not, how is the lost income replaced?

Having appropriate business intelligence in place can help alleviate some of the strategic challenges that rapid indirect member growth can create.  Be clear in how you count new members and how your credit union could manage through a changing indirect auto environment.  This can help ensure the credit union remains relevant and sustainable over the long term.

Strategic Budgeting/Forecasting Questions: Establish Appropriate Measures of Success

, , ,

The fourth entry in our 6 blog series about Strategic Budgeting/Forecasting Questions addresses measures of success, and how they should connect to the budget or forecast.

Question 4 – Are our financial measures of success handcuffing the credit union strategically?

There are many examples of appropriate and inappropriate measures of success as they relate to the budget and strategy. Some measures even come with unintended consequences. Measures should reflect, as closely as possible, what the credit union is really trying to accomplish, such as more engaged members or a profitable structure. Sometimes, measures that have existed in that past are kept as a matter of habit and simply aren’t updated in accordance with the plan.

Let’s assume that a credit union has a strategy to target members in their mid 20s to 30s to serve as a pipeline for the future. Beyond ROA and net worth, here are examples of some common measures of success:

  • Low delinquency: Choosing to target younger members is likely to come with more credit risk, so a measure of success that keeps delinquency at the same or lower levels may be in conflict with the plan. Not all younger members have higher credit risk, but focusing on low delinquency could lead the credit union to say no to the very members it is trying to attract, damaging its reputation with this group who likes to share their experiences. Setting this measure to realistic levels at the outset also helps stakeholders be more comfortable when higher delinquencies appear. It may be reasonable, in this situation, to budget a higher PLL
  • Products per member (PPM) or products per household (PPH): A strategy that aims to bring in new members is likely to reduce PPM and PPH. New members tend to have fewer products early on. An organization that is trying to increase PPM and PPH will be intent on getting existing members to do more business with the credit union, which could create little motivation to capture the target group. Consider measuring new members or households separately if measuring PPM or PPH
  • Member satisfaction/Net Promoter Score (NPS): A credit union that is successful in attracting younger members could find their overall member satisfaction or NPS dropping. Many credit unions find that, after segmenting by age, scores for younger members are much lower than for older members. Telling the organization to improve member satisfaction or NPS could work against the strategy to attract younger members. Consider measuring score trends segmented by age
  • Asset growth: Younger members usually don’t bring a lot of deposit dollars and deposit growth usually drives asset growth. If the asset growth measure requires special effort to be successful, those efforts will reasonably be focused on older members, pushing the target group to a lower priority
  • Loan growth: Similar to asset growth, younger people usually don’t bring a lot of loans to the credit union. Loan dollars borrowed per member is usually heaviest for people in their 50s. A push for loan growth will also push the target group to a lower priority

Other considerations to keep in mind when setting measures of success:

  • Member growth: When measuring the number of new members, remember that it’s easy to grow $5 member accounts, so consider whether that’s really success when setting measures for this strategy
  • Member growth and indirect lending: Growth in indirect lending could increase membership in the target group, but is that a good thing? Indirect members often have a single product (an indirect loan) and it is commonly acknowledged that it is difficult to convert those members to “real” members who use other credit union products. Including these members in member growth measures could show an uptick while failing the strategy of filling the pipeline. Consider measuring members that come from the indirect lending channel separately from direct members
  • Member growth and PPM/PPH loopholes: By not purging inactive members, growth will look better. At the same time, purging inactive members can make PPM and PPH increase without accomplishing anything. Consider adding caveats to measures that can be easily improved without actually getting any closer to the strategy
  • Member engagement: Don’t just focus on products when evaluating engagement; consider services, especially those from other areas of the credit union, such as insurance or wealth management

Assuming the budget reflects the strategic initiatives, which we discussed in the second blog in this series, stakeholders should view the measures of success through the lens of the budget. If it’s not clear how the budget leads to the measures, or if the measures are in conflict with the budget or the strategy, stakeholders should be asking questions. The goal is for everyone to emerge from the budgeting and strategic planning processes with a realistic view of what success looks like.

3 Common Lending Misconceptions to Avoid

,

In a recent blog, we posed 4 questions that you should answer about your lending experience.  Today, we want to drill down a little further into some common beliefs that have, more often than not, been disproven by the data.

1.  We prioritize service for our direct members. Do you think that the loans you make directly to your members should take longer than loans initiated through dealerships?  Most would say no, but it’s common to see that times for approval and funding are slower for direct lending channels.  On the surface it doesn’t make sense, but the dealer space is competitive.  Credit unions know they must act quickly or lose the deal, so those processes are designed for speed. It’s not that credit unions want to make their “real” members jump through hoops and wait longer while offering a streamlined process for booking loans to people they don’t know at lower rates, it’s often a lack of focus on improving direct lending processes.
Action Item: Don’t go by your gut.  Actually count your lending business by tracking how long it takes for the different channels.  Hint: Look at it by credit tier, too.
2.  We are staffed appropriately for when our members want to do business. Lending data often shows a dip in the number of loan applications 17-02-cl-blog(apps) that come in during lunch time.  This seems counter intuitive until you look at staffing during those times.  People need to eat, so it is common for fewer representatives to be available just when members want to drop by at lunch to talk about a loan.  A mid-day dip in loan apps could mean that members are walking away or hanging up because the wait is too long.
Action Item: Track application received times for branches and call centers, and look at scheduling if they drop in during lunch.  Note: When we analyze by channel, we don’t generally see any slowdown in online and mobile applications during lunch.
3.  Approval times for our online and mobile apps are longer than branch/call center because most of them come in outside of business hours. The numbers don’t usually bear this out.  While some apps are received outside of hours, the bulk of online and mobile apps are typically received throughout the week during business hours.  If that’s the case and those members are waiting longer for a decision, it could indicate a poor process for handling those apps.  Consider that members who choose to apply via digital channels may be expecting a fast, easy, FinTech-like experience.  Credit unions that deliver a clunky experience run the risk of not getting a second chance.  Even if the software interface isn’t where you want it to be, the rest of the process can still be fast and efficient.
Action Item: Track the approval times for online and mobile apps.  Track those that come in during business hours separately for a clearer view of the member experience.  Hint: Look at them by credit tier, too; don’t assume they are all low credit or frivolous applications.  It is true that digital apps have some unique challenges, but there is big growth in this channel, so getting great at processing them is key.

The biggest challenge in validating assumptions is simply recognizing that they exist.  Any time you find yourself saying, “Oh that’s because…,” pause for a moment to consider whether it’s actually an assumption.

There is a treasure trove of data at the fingertips of most credit unions that can be used to ferret out the truth about assumptions once they’re identified.  The 3 misconceptions in this blog were uncovered by going beyond looking at overall funding ratios and other common high-level metrics.

Slicing and dicing the data that’s readily available by credit tier, product, delivery channel, branch, and time received, to name a few, and tracking trends over time creates actionable business intelligence that sparks the necessary questions.  Expanding queries beyond lending to account opening and other areas could also reveal many meaningful, valuable process improvement opportunities.