Posts

Is The Yield Curve Flattening?

,

Going back to the end of 2015, the Federal Reserve has lifted the Fed Funds rate up from its zero lower bound to target a range of 1.25% to 1.50%, with additional tightening anticipated in 2018.

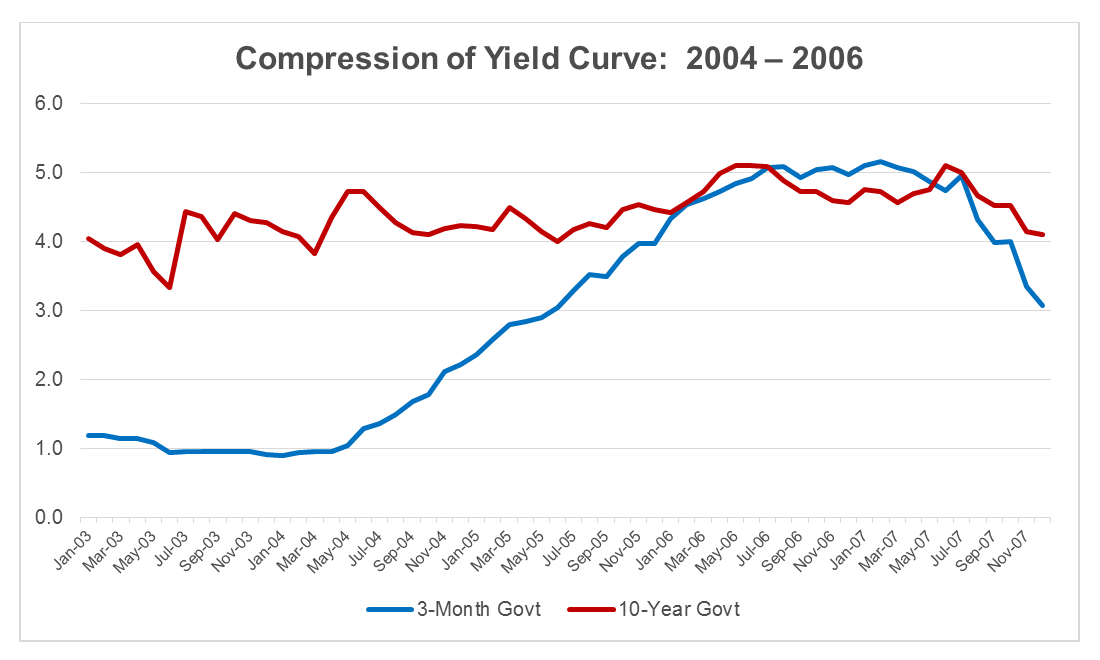
Often, when places model risk, it is assumed that when short-term rates move, long-term rates will move parallel.  Thus, when short-term rates increase, it is often expected that long-term rates will also increase—but this is often not the case.  From 2004 to 2006, the Fed raised the Fed Funds rate from its target of 1.00% up to 5.25%.  Short-term rates responded, but long-term rates did not move very much.  This led to then-Federal Reserve Chairman Alan Greenspan’s “conundrum” comment and an inverted yield curve:

A graph showing the compression of yield curve, 2004-2006

Since longer-term rates influence yield on assets, and shorter-term rates influence cost of funds, the difference between short- and long-term rates is important for credit union earnings.  When the difference is larger it can help credit union margins, and when short- and long-term rates are closer together, it can squeeze margins.  A sophisticated model should automatically change the shape of, or “twist,” the yield curve with every simulation and what-if scenario that is modeled.

The importance of twisting the yield curve on every simulation and what-if scenario cannot be overlooked.  During the tightening from 2004 to 2006, for example, cost of funds for credit unions $1 billion to $10 billion in assets increased 1.27%, while the yield on earning assets increased just 0.88%, according to NCUA data.  This move took about a 40 bp bite out of these credit unions’ net interest margins.

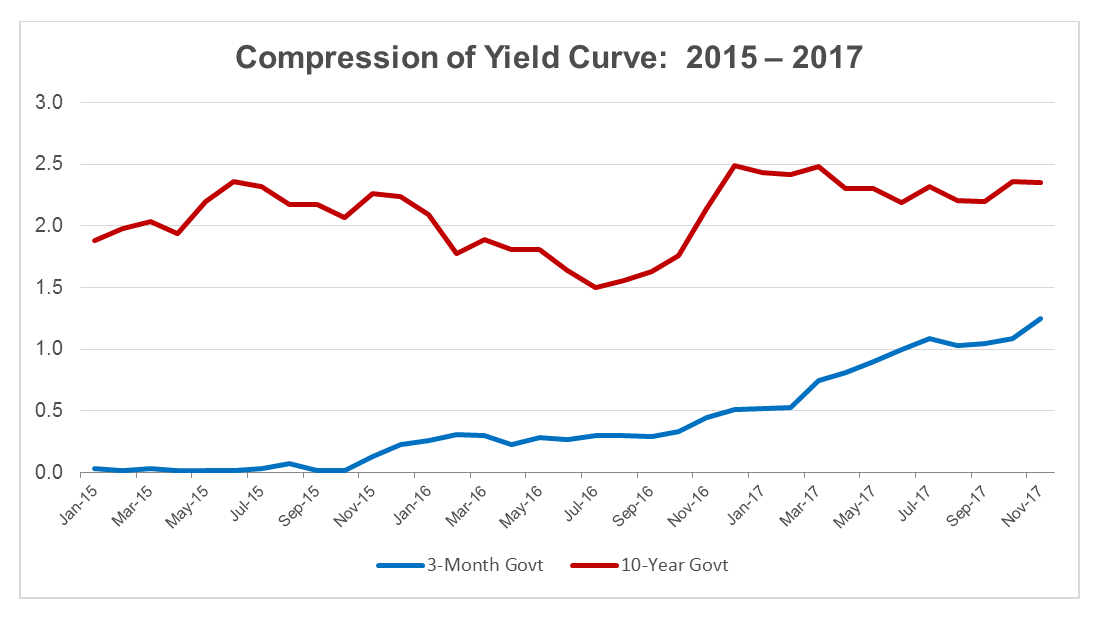
As we look at recent history, we see that, once again, as the Fed is tightening its rates, the yield curve is compressing.  Will it flatten out or invert as it did the last time the Fed tightened?  No one knows, but it is compressing:

A graph showing the compression of yield curve, 2015-2017

Assuming a parallel increase will generate a higher yield on assets and will result in a higher simulated margin than may be experienced with yield curve compression.  Often, twists of the yield curve are incorporated into modeling once per year as part of stress testing.  Compression of the yield curve as the Fed tightens is not a stress test.  History has shown this to be a common expectation.  We run thousands of simulations and what-if scenarios every year, each one of them testing a wide range of rate environments and yield curve shapes.  We encourage every institution to incorporate the real risk of yield curves changing in every simulation.

Trends in Auto Sales and Prices: Questions to Consider

, ,

Automakers have been informing investors for months now of a potentially difficult road ahead. Recent articles indicate trends that may present risks or opportunity to your credit union, depending on your situation.

Auto sales have declined the first three months of the year with the current, seasonally-adjusted pace annualizing out to 16.6 million compared to 16.7 million this time last year. Goldman Sachs Group, Inc. is now estimating demand for only about 15 million vehicles in 2017. Compare that to the record of 17.6 million set in 2016. (Source: Bloomberg)

For used cars, the National Automobile17-04-car-row Dealers Association’s (NADA) price index dropped in February by the most since November 2008. Both General Motors and Ford have warned about lower used car prices as many cars come off leases and into the used car pool. (Source: Bloomberg)

Additionally, auto loan delinquencies have increased across all credit tiers causing some lenders to tighten terms or pull back.

As you plan for the remainder of the year and beyond, the list below offers some great discussion topics for ALCO meetings and/or reforecast scenarios to consider:
If auto lending declines, what other avenues are available to us to grow loans? What investment opportunities are available?

  • How might slower-than-expected auto growth impact earnings?
  • If the average used car price falls, how many additional loans will need to be booked in order to meet budget goals? Given our current funding rate, how many more applications would we have to process in order to book those additional loans? How could we process more loan applications without adding expenses related to additional staff or overtime pay?
  • What if we have to dramatically reduce offering rates or increase fees paid to dealers to get the volume?
  • What if credit losses are higher than expected?
  • Are there opportunities that could be created if competition pulls back? Should we take advantage of any such opportunity?
  • How might loan demand be impacted if interest rates rise?
  • What if interest rates rise, putting pressure on us to raise deposit rates, but fierce competition for auto loans leaves us unable to raise loan rates?

The list above is not all inclusive but is a great start. As with most things, there are both opportunities and risks to consider. The sooner you start to consider them, the better off your credit union will be.