Posts

Now is the Time to Strategize on Investments

, ,

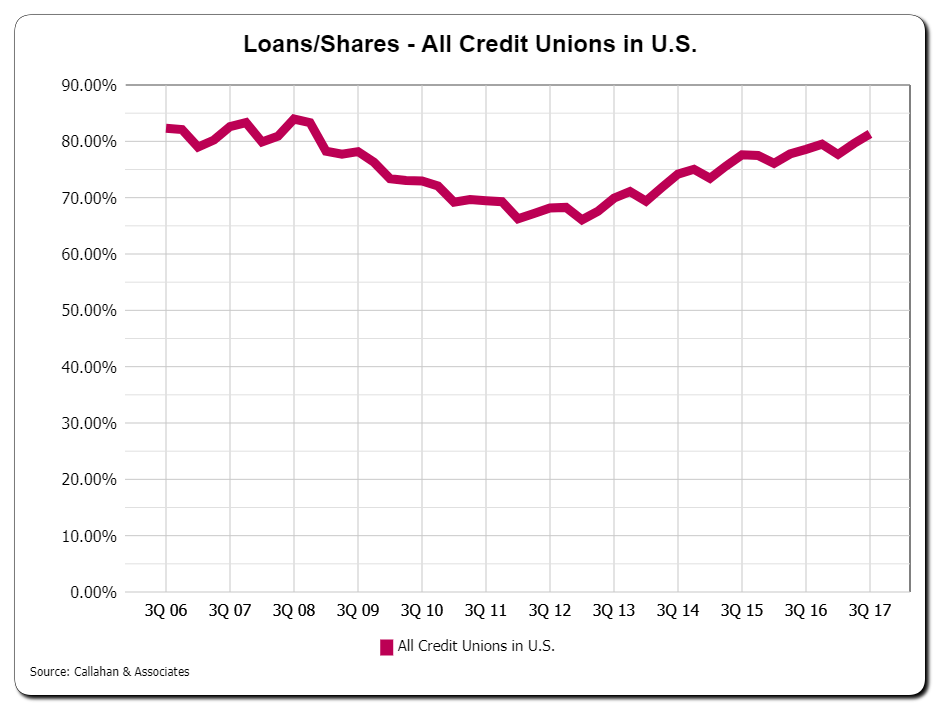
After the Great Recession, credit union loan-to-share ratios declined steeply and didn’t begin their long, slow recovery until 2013.  It has taken 4 more years to approach pre-crisis levels.  Now, credit unions are beginning to face very different questions than they have since the financial crisis.

Even if your credit union isn’t feeling a liquidity squeeze, now is the time to strategize on the investment portfolio you’ll want to have if loan growth continues to outpace share growth.

Graph showing loans-to-shares for all credit unions in the U.S., 2006-2017

The type of investment portfolio that works well for an institution with 35% of shares in investments will likely be quite different from one that has 10% in investments.  Large investment portfolios often shoulder a hefty profitability burden for the institution.  As loan balances grow, investments may need to serve more of an interest rate mitigation function.  Of course, liquidity needs are also a factor.

Here are some things to keep in mind as you think through the possibilities:

  • If loan growth patterns continue, will the loan portfolio shift toward having more or less interest rate risk?  Will the loan growth cause the yield on loans to increase or decrease?  This can help guide the structuring of investments to balance risk and profitability for the institution as a whole
  • How does the future loan portfolio align with risk limits?  For example, if loan growth is pushing the balance sheet up against interest rate risk limits, can the investment portfolio be used to offset the additional risk?  At the same time, if there isn’t much interest rate risk in the loan portfolio, there might be more room for interest rate risk, and the higher returns that usually accompany it, in the investment portfolio
  • What will be needed for liquidity?  While there are a variety of levers to pull for liquidity, be sure to consider how much of the investment portfolio strategy will be dictated by liquidity needs
  • How might selling investments help to rebalance risk or increase liquidity even if those investments are sold at a loss?  Selling at a loss does not mean the investments were “bad.”  Looking at the total interest earned in comparison to the loss can help provide perspective on how the investment performed for the credit union.  Also factor in what the funds will earn when they are loaned out (and serving members).  Often the loss is a small price to pay to address greater strategic needs
  • Test, test, test!  Test drive your ideas by modeling various future structures in a wide range of interest rate environments

Thinking through what your structure could look like if current trends continue will help lead to better investment decisions today in preparation for tomorrow.  Taking the time to strategize now and form a clearer picture of the future can only enhance the sustainability of your business model.

Increase In Intermediate- And Long-Term Rates, Potential Increase In Risk-Based Net Worth Required

With the change in intermediate- and long-term rates since the last Call Report cycle ending June 30, 2013, credit unions may find that the reported weighted-average life (WAVG life) of their investment portfolios has changed. This may be true even if no new investment purchases were made. This change in reporting on the 5300 will have an impact on the Risk-Based Net Worth (RBNW) requirement calculated.

For many investments with optionality (callable agencies, MBS pass-thrus, CMOs, etc…) that credit unions purchase, a change in long-term rates also results in changes to WAVG life calculations. As interest rates increase, prepayment of these investments with optionality slows. Additionally, investments that were previously assumed to call may now remain on credit union books longer, thus increasing their WAVG life.

For purposes of calculating RBNW requirements, investments with WAVG lives in excess of 3 years carry more weight than investments with WAVG lives less than 3 years. Boards and senior management teams should be prepared to see an increase in this number over the last call report period. While it is always recommended to understand what other reasons there may be for a change in this number, credit unions should first look to their reported investment WAVG lives in evaluating the reason for the change.

“My investment portfolio is not working for me!”

,

This is a statement heard more frequently in the past couple of years.  For those thinking it, here are some questions worth considering.

Question 1:  Is my lending process working for me?

The economy shows glimmers of improvement, with home values up and consistent increases in new auto sales as some evidence.  Before turning to investments, make sure your core business is maximized.  It is important to count your business – every day; as noted in the article Thriving In A World Of Shrinking Margins, questions to consider include:

  • How many loan applications are we getting? How many are we approving? How many are we funding?
  • If our approvals are low (compared to the number of applications), are we attracting the wrong borrowers and, in the process, hurting our reputation?
  • If our funding rate is low (compared to the number of approvals), what can we do to improve it?

Question 2:  Is my business model working for me?

If you feel your loan department is doing the best it can, then a bigger question may need to be asked: Are we chasing the right target market? Consider that, at the end of 2000, the credit union industry had 20% of its loans in new autos and 20% of its loans in used autos.  Fast forward to 2007, as the recent recession was about to flex its muscles, the numbers had dropped to 16%, respectively.  As of September 2012, the percentages stood at 10% and 18%, respectively.  The numbers represent a declining market share in new autos.

Count your business and find other numbers that can tell a story:

  • How many branch transactions do you have today relative to just 3 years ago?
  • How many online banking and mobile transactions do you have today compared to 3 years ago?
  • Segment your borrowers by age and you may be surprised that your borrowers are not as young as you think.

The trends in auto loans, branch use, electronic transactions and the shifting demographic of borrowers are signs that a business model that was successful in 2000 may need some fine tuning for a sustainable future.

A fine-tuned business model may realign priorities and resources and you may not need to rely so much on your investment portfolio.

Question 3:  Is it a good thing that my investment portfolio is not working for me?

Some credit unions have a high loan-to-asset ratio and strong earnings and still feel like they’re leaving money on the table because their relatively small investment portfolio is earning little. Before focusing on the performance of one slice of your financial structure, understand how the whole structure is working together. It may be that a low-yielding investment portfolio may be providing you with interest rate risk protection you need from the longer-term loans you made for the benefit of your membership.

Risks In A CMO Portfolio – How Government-Sponsored Refinancing Increases Extension Risk

On June 1st, the Federal Housing Finance Agency (FHFA) issued a press release noting that Home Affordable Refinance Program (HARP) refinances have nearly doubled to 180,000 from 93,000 when comparing 1st quarter 2012 to 4th quarter 2011. While this is good news for struggling and underwater borrowers that can take advantage of the program, this is most definitely not good news for many CMO investment portfolios on credit union books today.

A “typical” CMO is derived from a pool of mortgages and is engineered to assign priorities to the cash flows received from payments, both scheduled payments and unscheduled payoffs. The same pool of mortgages typically results in multiple CMOs which are divided into Planned Amortization Class (PAC) or Companion (Support) tranches. Although other types of CMO tranches do exist, this brief analysis will focus on the relationship between PACs and their companion tranches.

A PAC (sometimes divided into multiple levels, e.g., PAC I, PAC II, etc.) is designed to establish a fixed principal payment schedule that is relatively stable in a range of environments. These tranches have first priority to cash flows from the underlying mortgages. Once the portion of scheduled cash flows has been satisfied, any remaining cash flows from principal payments flow to lower-priority PAC tranches and then to their support tranches.

If these PAC tranches, especially PAC I or II with the highest priority, are engineered to have the most stable cash flows out of any CMO investment, where does the risk come in? The risk comes from the reduced principal balances in the support tranches. As the underlying mortgages either prepay or extend, the cash flows for the support tranches either speed up or slow down. As the economy has been in such a historically low interest rate environment, those borrowers that have been able to refinance probably already have, sending more principal to the support tranche of the respective pool of mortgages that make up the CMO investments. This reduces the ability of the support tranches to continue to support prepayment activity and, more importantly, help absorb the extension risk of the underlying mortgages.

Increasing the refinance activity of all FNMA or FHLMC guaranteed mortgages can have the unintended consequence of extending the principal cash flows on PAC tranches, especially if rates were to go up, by continuing the reduction of the support tranches. Any mortgages left in the pool that are not eligible for the refinance program may continue to pay as agreed, resulting in the extension in the CMOs that are left—which will undoubtedly include some PAC I and II tranches.

Credit unions should be continually monitoring the extension risk in their CMO portfolios. Minimally, credit unions should be looking in the current rate environment and in a +300bps rate shock scenario though going beyond a +300 is ideal. For clients of c. myers that elect to have their CMO cash flows analyzed, the cash flows are analyzed in at least 13 different long-term rate environments. This level of analysis goes well beyond industry standard and can help credit union management teams realize when investment strategies may need to change to accommodate the presence of extension risk in CMO portfolios.

Are You Feeling Liquid?

It may be the last thing you think you need to worry about—needing liquidity.

However, the things furthest from your mind could be the most important to think about in the risk management process.  Risk management is, in part, an exercise of thinking about and preparing for the unexpected.  When was the last time threats to liquidity were discussed in your ALCO?  What could lead to a bad liquidity scenario?  What could be the impact to earnings and net worth in this bad liquidity scenario?  When was the last time contingency liquidity sources were tested—not just for availability but operationally?  It is no different than having a backup generator for power.  Having it is good but making sure it works is the critical part.

While low loan growth and too much liquidity are more common topics right now, it is important, at least annually, that the ALCO discusses contingent liquidity and the results from testing contingency liquidity sources.

In liquidity modeling and discussions it is important to consider the impact of the investment portfolio.  Some credit unions are purchasing longer investments, many of which are not amortizing and/or have optionality (prepayments, call features, etc.).  The risk management process should consider the cash flow and earnings implications, including:

  • What if these bonds do not get called (or prepay) as expected?
  • What is the potential impact on liquidity?

It is common for credit unions to assume they will be able to liquidate their bonds if needed.  It is important to consider the implications of not being able to sell them in a timely fashion or the financial impact of selling them at a loss, such as after a rate increase.