Posts

Concentration Risk Limits on Mortgage-related Assets and the Unintended Consequences

,

Not all mortgage-related assets are created equal.  Therefore, using a one-size-fits-all approach in establishing concentration risk limits can lead to missed opportunities or a false sense of security.

Concentration risk policies are intended to reduce the impact a risk event could have on a credit union’s balance sheet, financial structure, and/or business model.  The NCUA cites the Basel Committee on Banking Supervision when defining the concept, stating:

A risk concentration is any single exposure or group of exposures with the potential to produce losses large enough (relative to capital, total assets, or overall risk level) to threaten a financial institution’s health or ability to maintain its core operations.

An effective risk management policy and process should incorporate an understanding of the aggregate risk exposure present in a credit union’s financial structure. This is key to ensuring that the overall risk level in the credit union’s financial structure does not exceed the institution’s risk threshold, nor does it place the overall health or viability of the institution at risk.

Concentration risk limits on mortgage-related assets and their unintended consequences on a credit union's balance sheet, business model and/or financial structure.

Supplemental to an effective aggregate risk management process would be limits on certain key areas, or “hot spots,” that fit the definition of a risk concentration, as referenced above from the Basel Committee. Frequently, mortgage-related assets are lumped into a single category and defined as a risk concentration based upon the underlying collateral (mortgages). However, the risk present across all types of mortgage-related assets is not the same. Consider the risks present in:

Some of the above carry liquidity risk, some carry credit risk, others carry interest rate risk (IRR) – and some carry a little of all the listed risks. However, the degree of risk is different for each. The interest rate risk profile of a floating-rate collateralized mortgage obligation (CMO) is materially different than that of a 30-year conventional mortgage. The liquidity risk in a 50% LTV first lien HELOC with a 15% average utilization rate is materially different than the Government National Mortgage Association (GNMA) mortgage-backed security (MBS) pass-through.

Part of an effective overall concentration risk management policy is to document the risk(s) addressed by a particular limit. Instead of setting a single limit on all mortgage-related assets, management teams should invest the time it takes to identify the risk(s) across all types of mortgage-related assets, and set limits where it is determined a concentration exists. As mentioned above, setting a single limit on mortgage-related assets can lead to missed opportunities or lull decision-makers into a false sense of security. Having a robust process to identify and manage the aggregate exposure of risks that could significantly threaten a credit union’s net worth is a critical component of the asset/liability management (A/LM) process.

Interest Rate Risk Management: Timing of Earnings Matters

,

Would it surprise you that some interest rate risk mitigation strategies actually add risk for a period of time?  In the end, these strategies may be effective at mitigating interest rate risk but it may take years for the effectiveness to be felt.  The challenge is that many methods used to test mitigation options, like NEV, don’t show decision-makers the full picture.  The reality is that earnings and the timing of earnings matter when understanding the impact of different decisions.

Take for example, a credit union that decides to sell $90.0 million of its 30-year fixed rate mortgages earning 3.61% and reinvest in auto participations earning 1.90% to mitigate interest rate risk.  No surprise that such a move hurts earnings today.  In fact, it would hurt earnings by 23 bps.

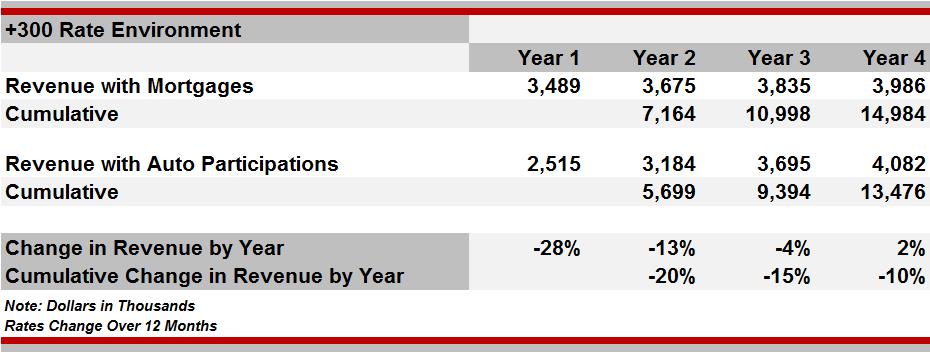
What is not obvious, though, is that in a +300 bp interest rate environment they would give up more cumulative revenue with a strategy to hold auto participations than with a strategy to hold fixed-rate mortgages over a four-year time horizon.  Year-by-year and cumulative revenues for both strategies are summarized below:

The credit union would earn more revenue holding fixed-rate mortgages than holding auto participations for each of the next three years.  It is not until Year 4 that the strategy change pays off and they earn more holding auto participations.  Over the four-year period, the credit union would earn a cumulative $15.0 million with mortgages versus $13.5 million with auto participations in the +300 bp increase.  Timing of earnings matters.

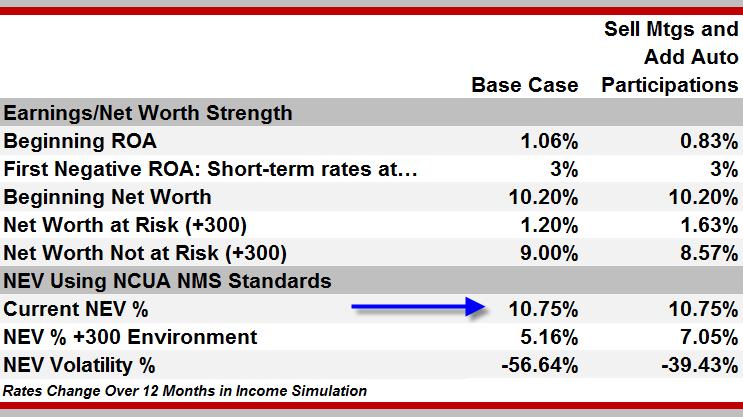
Using only NEV to evaluate this strategy might lead the credit union to pull the trigger on it.  In this case, the credit union is using NCUA’s NMS values from the NEV Supervisory Test.  When comparing the proposed strategy to the base, the NEV in the current rate environment is unchanged at 10.75% – meaning the restructure neither helps nor hurts the current NEV.

However, after selling the mortgages, the volatility decreased in the +300 bp environment leaving a higher NEV ratio (see example above).  An added benefit is that the credit union would now be considered low risk under NCUA’s NEV Supervisory Test thresholds.  Said differently, the NEV results show decision-makers would not have to sacrifice a thing in the current rate environment while significantly reducing risk in a +300 bp interest rate change.

Earnings (see Beginning ROA), on the other hand, show there is sacrifice in the current rate environment and more risk to earnings and net worth in a +300 bp rate environment over a four-year time frame.

The moral of this story is not that all credit unions should always hold mortgages because they will earn more than other alternatives.  Certainly, not.  It should be clear, though, that NEV provides credit union decision-makers with a limited picture.  Earnings and the timing of earnings matter.  In this particular example, the credit union may decide to execute the strategy, but decision-makers understand, in advance, that even if interest rates rise quickly, it could take about four years before the alternative strategy will contribute positive earnings and start to reduce interest rate risk.

For more in-depth ways to use ALM as actionable business intelligence, please click here for our c. notes.

c. notes – Evaluating Risk/Return Trade-offs When Margins Are Razor Thin

, ,

It is no secret that decisions today are more complex and far-reaching than ever before, and margins are razor thin. Traditional and non-traditional competitors on the battlefield keep multiplying and plotting to get more of consumers’ business, all while credit unions have to throw resources toward protecting their flank from attacks such as the CFPB, CECL, NCUA’s NEV test, and RBC.

This c. notes outlines advanced approaches to evaluating risk/return trade-offs so that decision-makers can have actionable business intelligence at their fingertips.

To continue reading, please click here.

The Importance of Isolating Variables within Stress Tests

,

Stress testing is an important function of long-term interest rate risk modeling and risk management processes. As with any long-term interest rate modeling, stress testing requires both skill as well as an ability to fully understand and determine which assumptions influence the outputs and which assumptions are driving the results of the stress test.

During a recent model validation we performed, the importance of isolating variables within stress testing was punctuated once again. The objective of this particular stress test was to understand the impact widening credit spreads would have on asset valuations within the net economic value (NEV) simulation. In looking at the impact of widening the credit spreads, we observed that the overall NEV ratio was not as adversely impacted as one would have expected and as the asset devaluation would have implied.

Given that the overall results were not adding up, a deeper dive into the inputs was necessary. In analyzing the inputs, we discovered the model setting that widened the credit spreads on the assets had also increased the rates on the borrowing yield curve, which were being used to value non-maturity deposits (NMDs). The increase in the borrowing yield curve rates was thereby offsetting the asset devaluation caused by widening the credit spreads.

It is perhaps both reasonable and defendable to say that an increase in asset credit spreads could also be strongly correlated with an increase in borrowing rates. Indeed, both the science and math behind this stress test could be wholly appropriate. That said, however, increasing the rates on the borrowing yield curve unnecessarily detracted from both the spirit and objective of the stress test, which was to understand the impact widening the credit spreads would have on asset valuations.

The importance, therefore, of isolating variables when running stress tests and doing sensitivity analysis cannot be underestimated. It is both a science and an art, and interpreting whether the results of the stress test accomplish the objective and make sense should not be lost within the analysis.

Strategy and Risk Management – Is Leadership in Sync?

,

Understanding and prioritizing strategy has never been more complex, especially as new disruption continues within the industry. Beyond delivering valued products and services profitably to members while remaining safe and sound, decision-makers face new threats to remaining relevant as non-traditional competitors create inroads into financial services. With limited resources, success can depend on choosing the right path.

Creating an optimal strategic focus requires decision-makers to share a common understanding of threats to the business, and a clear assessment as to which of those threats warrant attention and resources. This is where linking risk management practices to strategic planning can provide effective guidance.

Consider the following simple, yet powerful, exercise with your team:

    1. Begin with a high-level review of the financial results and risk reporting you prepare and review every month or quarter: monthly financials, key ratios, A/LM results, credit policies, etc.
    2. Identify critical risk areas (see the example below), starting with elements from financial and risk reporting, then allowing the group to add to the list as necessary.

      Note: We are using relevancy as a broad category to describe the myriad of new competitive pressures and changing member expectations. This should be customized for your credit union’s uniqueness.

    3. As a group, rank each risk on a scale of 0-10 (0=Low Risk, 10=High Risk).Rank your risk level from 0-10

THE VALUE
Here’s where this exercise can create significant value, as decision-makers begin to link results with their gut feeling and appetite for risk. What is your level of risk? Where does it exist? Where would you most want to see improvement? For some, these discussions may identify:

  • A lack of understanding of a specific risk (an opportunity for training)
  • Difficulty comparing and ranking different risks (an opportunity to share different perspectives)
  • Differing opinions (a need to achieve consensus)

Each of these outcomes can create opportunities for the credit union such as:

  • Taking strategic discussions to the next level
  • Advancing risk management
  • Refining focus and allocation of resources

In addition to aligning strategic planning with risk assessments and management, consider the benefit of knowing that the leadership team shares a deeper, common understanding of the risks facing the credit union and the reasons driving strategic priorities.

As the credit union industry changes and faces new competitive pressures, linking strategic planning and risk management could be key to ensuring ongoing success.

Events

A/LM Education – Fundamentals – Full

The Fundamentals: Using A/LM as a Weapon

Recommended CPE Credit: Participants can earn up to 11.5 CPE credits

Program Description

This program provides an introduction into the fundamentals of asset and liability management (A/LM) for credit unions. Beyond an understanding of concepts necessary to address regulatory expectations, c. myers demonstrates the value of using A/LM to support effective decision-making in managing a safe and sound credit union.

The course covers the following main topics:

  • Understanding the role of government rate policy, regulation, and the broader economy on A/LM
  • Defining the characteristics of high-functioning credit unions
  • Investigating industry threats
  • Developing an understanding of risk measurement methodologies
  • Walking through case studies to demonstrate risk measurement and analysis
  • Evaluating modeling assumptions and their impact on reported results
  • Defining measures of success
  • Reviewing key policy considerations for the credit union

Learning Objectives

Our day-and-a-half flagship course addresses practical issues that credit unions struggle with daily. Like others, you’ll leave with a better grasp of the answers to questions such as:

  • What are high-functioning credit unions doing to remain relevant long term as the pace of change increases?
  • What are the five levers that contribute to ROA and how much control do we have over each one?
  • What are risk and reward trade-offs of trying to achieve a desired ROA today versus trying to protect a minimum net worth ratio for the future?
  • What does each modeling methodology tell us – or not tell us?
    • Net interest income (static and dynamic)
    • NEV (including OAS and stochastic)
    • Long-term net worth at risk
  • What are the top 10 observations from model validations?
  • What are the fundamental risks and rewards of different investments?
  • What are best practices for creating and using loan and deposit modeling assumptions?
  • What is important to know about new rules and regulations related to interest rate risk management (e.g., risk-based capital requirements)?

You’ll work in teams using case studies of real credit unions. We’ll quickly test decisions you’d consider if you were managing these credit unions and you’ll see how your decisions could change the financial performance and risk profiles of your case studies. You will leave the session better equipped to make business decisions using A/LM to evaluate those decisions.

Content level: Basic

Instructional Delivery Method: Group Live

Location: Courses are in sunny Phoenix, Arizona at our headquarters next to the South Mountain Preserve, the nation’s largest municipal park, with 51 miles of trails for hiking, biking, and horseback riding. You may even want to make a long weekend of it and visit Sedona or the Grand Canyon. We also are near several local favorites like the Desert Botanical Garden and the Phoenix Zoo.

CPE Field of Study: Finance                                               

Prerequisite Education or Experience: Basic familiarity with credit union financial statements

Advance Preparation Requirements: None

Who Should Attend: Any credit union board member, executive, manager, accountant or analyst with responsibility for understanding and/or managing asset and liability management

Fees, Refund, and Program Cancellation Policy

Fee*: $550 for one participant; $460 for each additional participant from the same credit union. Bring your entire ALCO to the same course for a flat fee of $1,535.

Refunds will not be given for cancellations received less than 30 days prior to the session; however, a substitute from your company is welcome.

In the rare case that a class must be cancelled, c. myers will make every effort to do so 30 days or more in advance of the class, in which case we are not responsible for travel costs or penalties incurred.

*Reduce your fee 15% by registering at least 30 days prior to the course.

Complaint Resolution Policy

c. myers will make every effort to resolve complaints regarding NASBA compliance within a reasonable amount of time and in a confidential manner. A formal complaint must be submitted in writing and must set forth a statement of the facts and the specific remedy sought. Submit complaints to:

c. myers corporation
Attn: CPE Program Administrator
8222 South 48th Street
Suite 275
Phoenix, AZ 85044

CPE Program Administrator: 800.238.7475

National_Registry_of_CPE_Sponsorsc. myers corporation is registered with the National Association of State Boards of Accountancy (NASBA) as a sponsor of continuing professional education on the National Registry of CPE Sponsors. State boards of accountancy have final authority on the acceptance of individual courses for CPE credit. Complaints regarding registered sponsors may be submitted to the National Registry of CPE Sponsors through its website: www.learningmarket.org.