Posts

Napkin Math: Value in the Current Rate Environment

, ,

In a previous napkin math video, we demonstrated an easy way to approximate the change in value when interest rates increase or decrease for bullet and amortizing products.  This latest entry in our Napkin Math video series shows how you can use that same approach to calculate how value has changed in the current rate environment.

When you have 2 to 3 minutes, please watch the new video and let us know what you think.  To view other Napkin Math videos, visit our videos page.

What-If Analysis In The Decision-Making Process – Test Your Hypothesis

,

Performing what-if analysis is an integral part of both the A/LM and budget processes. When used correctly, what-if analysis is a powerful way for decision-makers to understand the impact of items under consideration in real-time. The challenge is that often people dive right into modeling and results, producing a less than optimal process. Consider applying a scientific method to the what-if analysis to help strengthen the decision-making process.

The scientific method is essentially a hypothesis-driven methodology. Strong hypotheses lead to expectations either supported or refuted by analysis. What does this all mean? Well, it isn’t as intimidating as it might sound. From a financial modeling perspective, it means don’t just blindly rely on model results.

To help explain this concept further, consider a $1B credit union evaluating a strategy of moving $10M from overnights into 30-year fixed-rate mortgages:

What-If Analysis Test Your Hypothesis as Part of Decision-making Process


Before performing a what-if, the scientific method suggests that you first ask what you expect the results to look like, and then create a hypothesis. Start broadly with what you generally expect to happen to earnings in the current rate environment and the risk. In this case, the shift from overnights to mortgages should help earnings in today’s rate environment, adding risk as rates rise.

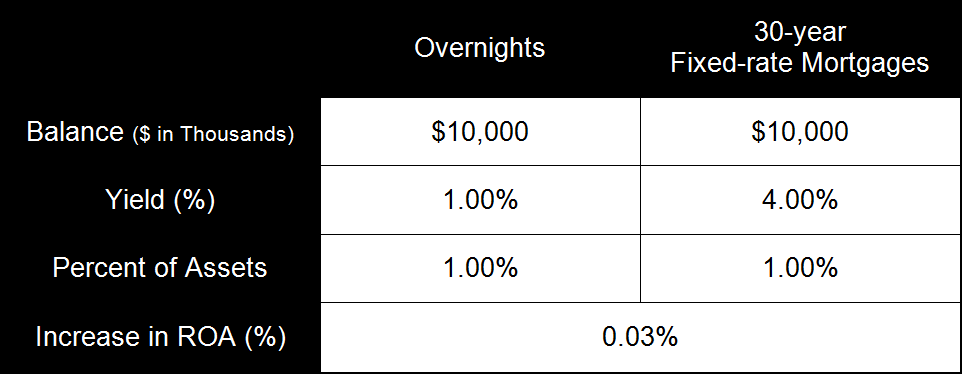
After identifying the broad expectation, take the next step and do some rough math to estimate the return on assets (ROA) impact of the what-if. Here, a $1B institution testing a strategy of moving 1.00% of its assets could expect a 3-basis-point improvement in the initial ROA (1% of assets multiplied by a 3% increase in yield):

What-If Analysis Testing Your Hypothesis as part of decision-making process


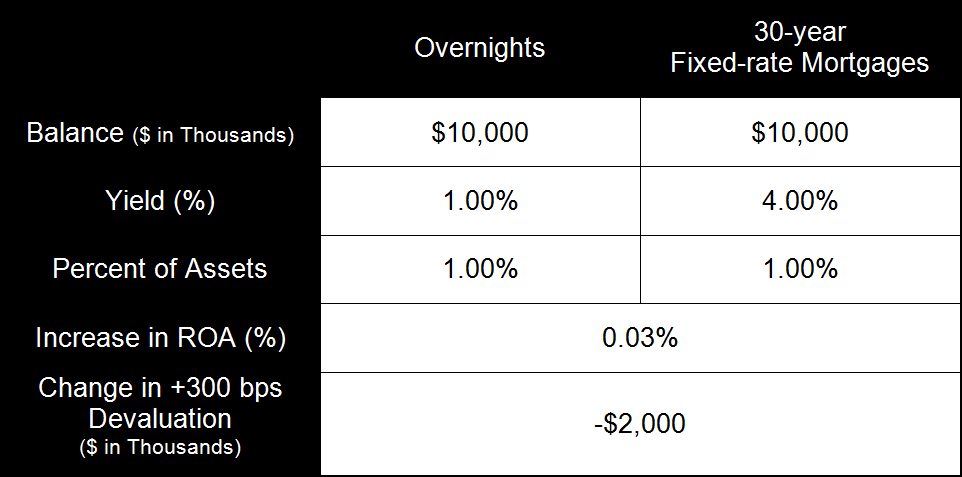
On the risk side, you can do the same with the impact to the net economic value (NEV) dollars since understanding the valuation impact is relatively straightforward. Overnights are at par in all rate environments while brand new 30-year mortgages devalue about 20% in a +300 basis points (bps) rate environment. Therefore, you’d expect to see a roughly $2M decrease in your NEV dollars in the +300 bps rate environment:

What-If Analysis as Part of the Decision-making Process Test Your Hypothesis


Analysis and observation are the next important steps in the scientific method. Run the what-if through the model and analyze the results in comparison to your expectation and rough math. Do the results of the what-if validate the hypothesis and, if not, why?

Periodically, results may not match up with the hypothesis, which is okay. It doesn’t necessarily mean the model or the hypothesis is incorrect. There could be other factors impacting the what-if. However, it is important to figure out why the results do not match up, especially if the difference is due to an input error.

For the example above, consider some of the following questions that could affect the what-if, causing the hypothesis and results not to match:

  • What was the credit risk assumption?
  • Will additional operating expenses and/or marketing dollars be needed to attract the growth?
  • Did we incorporate any fee income for the closing costs?
  • How long will it take to increase the portfolio $10M?


When it comes to the what-if process, shortcuts should not be taken. Always create an expectation internally before relying on model results. Depending exclusively on model results puts the user at risk of input errors and/or an inability to effectively explain what-if results.

Happy Thanksgiving!

On behalf of all of us at c. myers, we wish you a wonderful Thanksgiving holiday.

6 Dos and Don’ts of the NCUA’s NEV Supervisory Test

Consider the following as you implement the NCUA’s NEV Supervisory Test:

DO make sure to understand your answers by running NEV with the non-maturity deposit caps the test uses (currently 1% and 4%) before NCUA comes into your credit union.

DON’T forget why NCUA decided to standardize. One of many reasons is that there is “a significant amount of uncertainty surrounding valuation methods” for non-maturity deposits. If you are going to continue to use results of core deposit studies to determine non-maturity deposit values, it will be critical for your board and management to be absolutely clear on how these results will be used, if at all, in decision-making. For example, when testing what-ifs, which assumptions set will drive decisions if one set gives the green light and the other the red light?

DO make sure your policy represents your credit union’s appetite for risk. NCUA has clearly stated this. Avoid saying in policy, “We will accept a moderate level of risk using the thresholds identified in NCUA’s supervisory test.”

DON’T stop your asset/liability management (ALM) at the NEV supervisory test. By definition, any type of standardization means that the unique risks of an institution are not captured. To help with standardization and comparison across credit unions, the new NEV test treats all non-maturity deposits the same, credit union to credit union. As a result, the standardization ignores each credit union’s pricing, not to mention ignoring the pricing on each category such as regular shares, checking, and money markets.

DO remind your board and management that NEV does not quantify profitability (earnings) or risks to profitability and net worth. Earnings do matter. Earnings are what credit unions need to pay for products, services, and delivery channels that will keep them relevant. A simple way to remember that NEV does not quantify profitability is that it does not factor in non-interest income and operating expenses.

DON’T
forget that the timing of earnings and risks to earnings matters. NEV collapses all future cash flows to represent what the value would be today if shock interest rate environments were to occur. By definition, this can’t show decision-makers the timing of risks to earnings and, ultimately, net worth.

The world is becoming more complex. This complexity can bring opportunities and risks. The most important thing to remember is that ALM can and should be used to provide decision-makers with actionable business intelligence. The new NEV supervisory test is not designed to provide actionable business intelligence; it is simply a scoping tool.

The Importance of Isolating Variables within Stress Tests

,

Stress testing is an important function of long-term interest rate risk modeling and risk management processes. As with any long-term interest rate modeling, stress testing requires both skill as well as an ability to fully understand and determine which assumptions influence the outputs and which assumptions are driving the results of the stress test.

During a recent model validation we performed, the importance of isolating variables within stress testing was punctuated once again. The objective of this particular stress test was to understand the impact widening credit spreads would have on asset valuations within the net economic value (NEV) simulation. In looking at the impact of widening the credit spreads, we observed that the overall NEV ratio was not as adversely impacted as one would have expected and as the asset devaluation would have implied.

Given that the overall results were not adding up, a deeper dive into the inputs was necessary. In analyzing the inputs, we discovered the model setting that widened the credit spreads on the assets had also increased the rates on the borrowing yield curve, which were being used to value non-maturity deposits (NMDs). The increase in the borrowing yield curve rates was thereby offsetting the asset devaluation caused by widening the credit spreads.

It is perhaps both reasonable and defendable to say that an increase in asset credit spreads could also be strongly correlated with an increase in borrowing rates. Indeed, both the science and math behind this stress test could be wholly appropriate. That said, however, increasing the rates on the borrowing yield curve unnecessarily detracted from both the spirit and objective of the stress test, which was to understand the impact widening the credit spreads would have on asset valuations.

The importance, therefore, of isolating variables when running stress tests and doing sensitivity analysis cannot be underestimated. It is both a science and an art, and interpreting whether the results of the stress test accomplish the objective and make sense should not be lost within the analysis.

Events

NAFCU Webinar

Wednesday, August 16, 2017 | 2:00-3:30 p.m. ET

Speaker: Adam Johnson, EVP/Principal

NCUA’s Net Economic Value (NEV) Supervisory Test “measures the relative degree of market risk inherent in a credit union’s balance sheet, under a prescribed interest rate shock scenario, using standardized non-maturity share values.” This webcast breaks down the NEV test and how various credit union decision-makers are beginning to address the test in their ALM process. You’ll also learn ways to leverage the ALM process to improve profitability and relevancy.

Key Takeaways:

  • Put the supervisory test into perspective with real-world observations on test results
  • Understand business questions every ALM process should address to support relevancy in a highly competitive environment
  • Learn ALM topics decision-makers should consider that could impact profitability
  • Discover how to make your Asset Liability Committee (ALCO) meeting and process more strategic
  • Dig into scenarios that can enhance your ALM process

A/LM Education – Fundamentals – Full
The Fundamentals: Using A/LM as a Weapon

Recommended CPE Credit: Participants can earn up to 11.5 CPE credits

Program Description

This program provides an introduction into the fundamentals of asset and liability management (A/LM) for credit unions. Beyond an understanding of concepts necessary to address regulatory expectations, c. myers demonstrates the value of using A/LM to support effective decision-making in managing a safe and sound credit union.

The course covers the following main topics:

  • Understanding the role of government rate policy, regulation, and the broader economy on A/LM
  • Defining the characteristics of high-functioning credit unions
  • Investigating industry threats
  • Developing an understanding of risk measurement methodologies
  • Walking through case studies to demonstrate risk measurement and analysis
  • Evaluating modeling assumptions and their impact on reported results
  • Defining measures of success
  • Reviewing key policy considerations for the credit union

Learning Objectives

Our day-and-a-half flagship course addresses practical issues that credit unions struggle with daily. Like others, you’ll leave with a better grasp of the answers to questions such as:

  • What are high-functioning credit unions doing to remain relevant long term as the pace of change increases?
  • What are the five levers that contribute to ROA and how much control do we have over each one?
  • What are risk and reward trade-offs of trying to achieve a desired ROA today versus trying to protect a minimum net worth ratio for the future?
  • What does each modeling methodology tell us – or not tell us?
    • Net interest income (static and dynamic)
    • NEV (including OAS and stochastic)
    • Long-term net worth at risk
  • What are the top 10 observations from model validations?
  • What are the fundamental risks and rewards of different investments?
  • What are best practices for creating and using loan and deposit modeling assumptions?
  • What is important to know about new rules and regulations related to interest rate risk management (e.g., risk-based capital requirements)?

You’ll work in teams using case studies of real credit unions. We’ll quickly test decisions you’d consider if you were managing these credit unions and you’ll see how your decisions could change the financial performance and risk profiles of your case studies. You will leave the session better equipped to make business decisions using A/LM to evaluate those decisions.

Content level: Basic

Instructional Delivery Method: Group Live

Location: Courses are in sunny Phoenix, Arizona at our headquarters next to the South Mountain Preserve, the nation’s largest municipal park, with 51 miles of trails for hiking, biking, and horseback riding. You may even want to make a long weekend of it and visit Sedona or the Grand Canyon. We also are near several local favorites like the Desert Botanical Garden and the Phoenix Zoo.

CPE Field of Study: Finance                                               

Prerequisite Education or Experience: Basic familiarity with credit union financial statements

Advance Preparation Requirements: None

Who Should Attend: Any credit union board member, executive, manager, accountant or analyst with responsibility for understanding and/or managing asset and liability management

Fees, Refund, and Program Cancellation Policy

Fee*: $550 for one participant; $460 for each additional participant from the same credit union. Bring your entire ALCO to the same course for a flat fee of $1,535.

Refunds will not be given for cancellations received less than 30 days prior to the session; however, a substitute from your company is welcome.

In the rare case that a class must be cancelled, c. myers will make every effort to do so 30 days or more in advance of the class, in which case we are not responsible for travel costs or penalties incurred.

*Reduce your fee 15% by registering at least 30 days prior to the course.

Complaint Resolution Policy

c. myers will make every effort to resolve complaints regarding NASBA compliance within a reasonable amount of time and in a confidential manner. A formal complaint must be submitted in writing and must set forth a statement of the facts and the specific remedy sought. Submit complaints to:

c. myers corporation
Attn: CPE Program Administrator
8222 South 48th Street
Suite 275
Phoenix, AZ 85044

CPE Program Administrator: 800.238.7475

National_Registry_of_CPE_Sponsorsc. myers corporation is registered with the National Association of State Boards of Accountancy (NASBA) as a sponsor of continuing professional education on the National Registry of CPE Sponsors. State boards of accountancy have final authority on the acceptance of individual courses for CPE credit. Complaints regarding registered sponsors may be submitted to the National Registry of CPE Sponsors through its website: www.learningmarket.org.