Posts

What-If Analysis In The Decision-Making Process – Test Your Hypothesis

,

Performing what-if analysis is an integral part of both the A/LM and budget processes. When used correctly, what-if analysis is a powerful way for decision-makers to understand the impact of items under consideration in real-time. The challenge is that often people dive right into modeling and results, producing a less than optimal process. Consider applying a scientific method to the what-if analysis to help strengthen the decision-making process.

The scientific method is essentially a hypothesis-driven methodology. Strong hypotheses lead to expectations either supported or refuted by analysis. What does this all mean? Well, it isn’t as intimidating as it might sound. From a financial modeling perspective, it means don’t just blindly rely on model results.

To help explain this concept further, consider a $1B credit union evaluating a strategy of moving $10M from overnights into 30-year fixed-rate mortgages:

What-If Analysis Test Your Hypothesis as Part of Decision-making Process


Before performing a what-if, the scientific method suggests that you first ask what you expect the results to look like, and then create a hypothesis. Start broadly with what you generally expect to happen to earnings in the current rate environment and the risk. In this case, the shift from overnights to mortgages should help earnings in today’s rate environment, adding risk as rates rise.

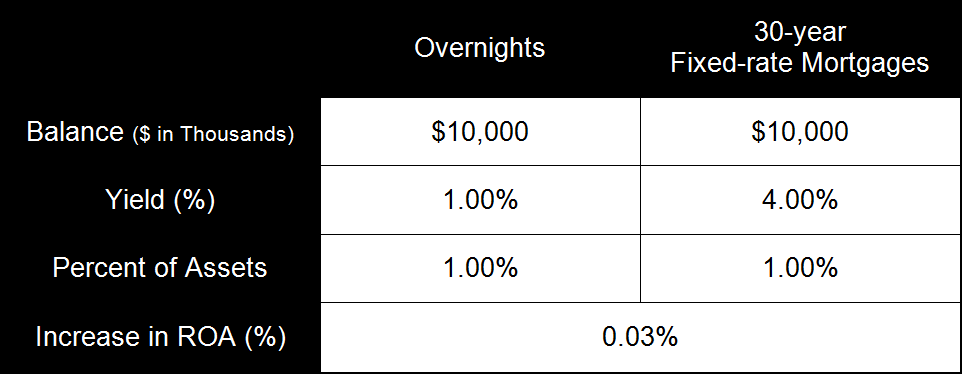
After identifying the broad expectation, take the next step and do some rough math to estimate the return on assets (ROA) impact of the what-if. Here, a $1B institution testing a strategy of moving 1.00% of its assets could expect a 3-basis-point improvement in the initial ROA (1% of assets multiplied by a 3% increase in yield):

What-If Analysis Testing Your Hypothesis as part of decision-making process


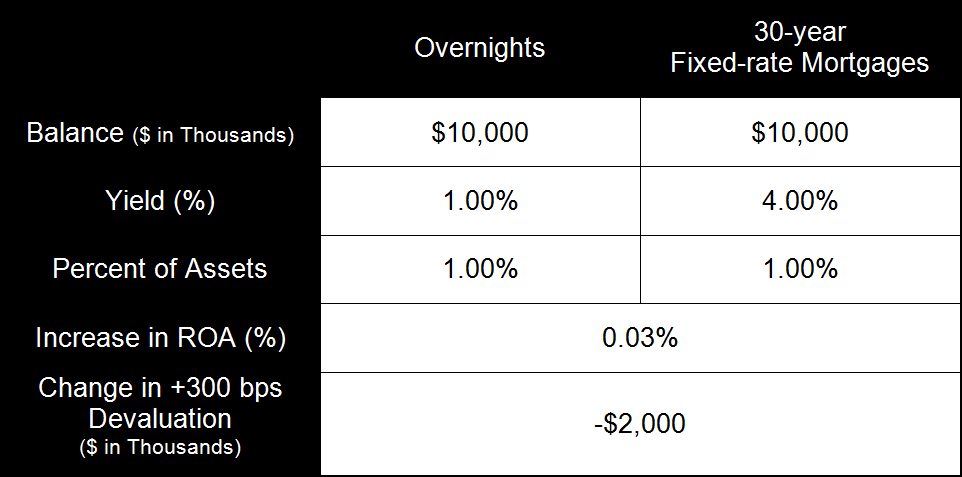
On the risk side, you can do the same with the impact to the net economic value (NEV) dollars since understanding the valuation impact is relatively straightforward. Overnights are at par in all rate environments while brand new 30-year mortgages devalue about 20% in a +300 basis points (bps) rate environment. Therefore, you’d expect to see a roughly $2M decrease in your NEV dollars in the +300 bps rate environment:

What-If Analysis as Part of the Decision-making Process Test Your Hypothesis


Analysis and observation are the next important steps in the scientific method. Run the what-if through the model and analyze the results in comparison to your expectation and rough math. Do the results of the what-if validate the hypothesis and, if not, why?

Periodically, results may not match up with the hypothesis, which is okay. It doesn’t necessarily mean the model or the hypothesis is incorrect. There could be other factors impacting the what-if. However, it is important to figure out why the results do not match up, especially if the difference is due to an input error.

For the example above, consider some of the following questions that could affect the what-if, causing the hypothesis and results not to match:

  • What was the credit risk assumption?
  • Will additional operating expenses and/or marketing dollars be needed to attract the growth?
  • Did we incorporate any fee income for the closing costs?
  • How long will it take to increase the portfolio $10M?


When it comes to the what-if process, shortcuts should not be taken. Always create an expectation internally before relying on model results. Depending exclusively on model results puts the user at risk of input errors and/or an inability to effectively explain what-if results.

Strategic Budgeting/Forecasting Questions: Establish Appropriate Measures of Success

, , ,

The fourth entry in our 6 blog series about Strategic Budgeting/Forecasting Questions addresses measures of success, and how they should connect to the budget or forecast.

Question 4 – Are our financial measures of success handcuffing the credit union strategically?

There are many examples of appropriate and inappropriate measures of success as they relate to the budget and strategy. Some measures even come with unintended consequences. Measures should reflect, as closely as possible, what the credit union is really trying to accomplish, such as more engaged members or a profitable structure. Sometimes, measures that have existed in that past are kept as a matter of habit and simply aren’t updated in accordance with the plan.

Let’s assume that a credit union has a strategy to target members in their mid 20s to 30s to serve as a pipeline for the future. Beyond ROA and net worth, here are examples of some common measures of success:

  • Low delinquency: Choosing to target younger members is likely to come with more credit risk, so a measure of success that keeps delinquency at the same or lower levels may be in conflict with the plan. Not all younger members have higher credit risk, but focusing on low delinquency could lead the credit union to say no to the very members it is trying to attract, damaging its reputation with this group who likes to share their experiences. Setting this measure to realistic levels at the outset also helps stakeholders be more comfortable when higher delinquencies appear. It may be reasonable, in this situation, to budget a higher PLL
  • Products per member (PPM) or products per household (PPH): A strategy that aims to bring in new members is likely to reduce PPM and PPH. New members tend to have fewer products early on. An organization that is trying to increase PPM and PPH will be intent on getting existing members to do more business with the credit union, which could create little motivation to capture the target group. Consider measuring new members or households separately if measuring PPM or PPH
  • Member satisfaction/Net Promoter Score (NPS): A credit union that is successful in attracting younger members could find their overall member satisfaction or NPS dropping. Many credit unions find that, after segmenting by age, scores for younger members are much lower than for older members. Telling the organization to improve member satisfaction or NPS could work against the strategy to attract younger members. Consider measuring score trends segmented by age
  • Asset growth: Younger members usually don’t bring a lot of deposit dollars and deposit growth usually drives asset growth. If the asset growth measure requires special effort to be successful, those efforts will reasonably be focused on older members, pushing the target group to a lower priority
  • Loan growth: Similar to asset growth, younger people usually don’t bring a lot of loans to the credit union. Loan dollars borrowed per member is usually heaviest for people in their 50s. A push for loan growth will also push the target group to a lower priority

Other considerations to keep in mind when setting measures of success:

  • Member growth: When measuring the number of new members, remember that it’s easy to grow $5 member accounts, so consider whether that’s really success when setting measures for this strategy
  • Member growth and indirect lending: Growth in indirect lending could increase membership in the target group, but is that a good thing? Indirect members often have a single product (an indirect loan) and it is commonly acknowledged that it is difficult to convert those members to “real” members who use other credit union products. Including these members in member growth measures could show an uptick while failing the strategy of filling the pipeline. Consider measuring members that come from the indirect lending channel separately from direct members
  • Member growth and PPM/PPH loopholes: By not purging inactive members, growth will look better. At the same time, purging inactive members can make PPM and PPH increase without accomplishing anything. Consider adding caveats to measures that can be easily improved without actually getting any closer to the strategy
  • Member engagement: Don’t just focus on products when evaluating engagement; consider services, especially those from other areas of the credit union, such as insurance or wealth management

Assuming the budget reflects the strategic initiatives, which we discussed in the second blog in this series, stakeholders should view the measures of success through the lens of the budget. If it’s not clear how the budget leads to the measures, or if the measures are in conflict with the budget or the strategy, stakeholders should be asking questions. The goal is for everyone to emerge from the budgeting and strategic planning processes with a realistic view of what success looks like.

Strategic Budgeting/Forecasting Questions: Representation of Strategic Initiatives in the Budget and Forecast

, , ,

The second entry in our 6 blog series about Strategic Budgeting/Forecasting Questions builds on an understanding of Question 1. Having identified the financial direction of each strategic initiative, decision-makers are better positioned to look at the budget and see how the initiatives are represented and, of course, ask “why” questions.

Question 2 – How are strategic initiatives represented in the budget and forecast?

Take, for example, a strategic initiative of being the lending machine. One of the first areas decision-makers would look to see how this initiative is represented in the budget is loan growth. Given the initiative, one would expect to see loans increasing compared to previous years. But, what if the loan growth in the budget was the same as previous years? Would that be reasonable? It depends, and what’s key in answering this question is understanding the “why.”

Example 1: Why is loan growth the same as the previous years? Answer 1: There are headwinds the credit union is facing when it comes to loan growth (more on this in the next blog in this series about Question 3 – What key forces could impact our forecast?). Without the lending machine initiative, loan growth would actually decrease in the following years. So the impact of the initiative is actually keeping the loan growth steady. This may be a reasonable answer.

Example 2: Why is loan growth the same as the previous years? Answer 2: The trending from the current year is carried forward into the budget. This is not a reasonable answer and is not representing the strategic initiative. In this case, the budget should be adjusted to reflect the initiative.

What can also be helpful is looking at the budgeting/forecasting trends with and without the impact of the initiatives. Start with a current path where the strategic initiative(s) are not incorporated and it is “business as usual.” Then run a path where the initiative(s) are included and compare the two.

Using the lending machine example, the chart below shows how loan growth and ROA would decline in the current path without implementing the initiative. With the initiative, loan growth stays steady in 2017 and rises in the years after, thus, increasing ROA and net worth. This comparison creates an opportunity to ask and discuss many “why” questions and see how the initiative is represented in the budget/forecast.

Again, the key is understanding the expected financial direction, looking for how that’s represented in the budgeting/forecasting, and then asking why. Even if the representation of the initiative in the budget is reasonable, it’s important to have strategic conversations on the “why” which will help create clarity among decision-makers.

Strategic Budgeting/Forecasting Questions: Connect Strategic Initiatives with Financial Direction

, ,

Strategic initiatives impact results – members may be better served and membership may grow, assets may grow, and earnings and net worth may increase. Some strategies may cause temporary or long-term reductions in membership, assets, earnings, or net worth. Budgets and forecasts should incorporate the anticipated impacts of strategic initiatives and establish common expectations for results. Connecting the dots to better understand the financial implications of strategic initiatives can lead to greater success.

In this and subsequent blogs, we will review 6 questions strategic boards can discuss during the budgeting and forecasting process to better connect the dots. These 6 questions are merely a starting point and will undoubtedly lead to more questions during the process, creating more thorough communication and a greater understanding of strategic plans.

Question 1 – What is the expected financial direction of each strategic initiative?

Begin with a simple, high-level assessment of strategic initiatives. Identify each strategic initiative with a short description. Then, consider what you believe will be the earnings impact next year and in the following years. For this exercise don’t focus on the numbers, just consider the direction of the impact. Draw a quick table or use a spreadsheet as follows:

17-05-tlb-blog

Consider that not all strategic initiatives will generate increases to earnings. The important point is to understand why. Some initiatives may hurt earnings in the short term to achieve longer-term improvements, while others might only reduce earnings. For example, a strategy might be to increase member giveback through reduced overdraft fees or installing additional ATMs for improved member access.

In this example, initiative #1 is to become the lending machine – perhaps to make the process more efficient and create capacity – or to generate more loans for the credit union. This initiative may include a project to implement new technology or acquire talent. In Year 1, the project is expected to incur costs that would reduce earnings, or the ROA. We indicate that in the chart with a downward arrow. By Year 2, however, we expect to see some additional loans or experience cost savings that would improve ROA. We show that with an upward arrow.

Continue to complete the chart.

17-05-tlb-blog-2

In Year 3 and beyond, the impact to ROA of the lending machine strategic initiative is expected to continuously increase.  We can use multiple arrows to show the additional impact expected.

For strategic initiative #2, to decrease account opening time, there’s no hard dollar costs in Year 1 as the credit union conducts an internal review and designs process improvements.  In Year 2 and beyond, the efficiencies are expected to lower costs and drive some additional new accounts, thereby increasing ROA.

Beyond looking at each strategic initiative, notice that now the aggregate expected impact of all initiatives can begin to be understood.  If all or a significant number of initiatives have negative ROA impacts, that can be an indication of needing to consider other, offsetting strategies to generate additional revenue.  Or, it may make sense to accept lower earnings for some period.  That would be important to recognize and to make sure that everyone, including the board and management, is on the same page with the expectation so there are no surprises.

After completing this exercise, board members and management can be better prepared to review the budget with a high-level expectation for how it may look.  If projections don’t align with expectations, more “why” questions can be asked and differences understood.  As financial results occur and new budgets are created, this can be a great tool to keep as a reference.  Strategic initiatives can be reassessed for what was originally expected versus what actually happened, and to determine what changed and why.

Interest Rate Risk Policy Limits: One Big Misconception

We initially published the blog below on January 28, 2016.  With interest rates having increased recently – and more increases seemingly on the horizon – we thought this a good topic to revisit as it has been coming up in model validations we complete.

We often see interest rate risk policy limits that rely too much on net interest income (NII) volatility and miss the absolute bottom-line exposure. Such reliance can cause boards and managements to unintentionally take on more risk than they intended.  Why?  Because these types of policy limits ignore strategy levers below the margin.

Establishing risk limits on only part of the financial structure is a common reason for why risks are not appropriately seen. Setting a risk limit focused on NII volatility does not consider the entire financial structure and can lead to unintended consequences.

For example, assume a credit union has a 12-month NII volatility risk limit of -30% in a +300 environment. The table below outlines their current situation and the margin and ROA they would be approving, as defined by policy, in a +300 bp rate shock.

17-03-buz-repost-image-1

By definition, the credit union is still within policy from an NII perspective but because of the drop in NII, ROA has now decreased from a positive 0.50% to a negative 0.43%. This example helps demonstrate that stopping at the margin when defining risk limits can result in a false sense of security.

Not All 30% Declines are Created Equal

To punctuate the point, let’s apply the 30% volatility limit to credit unions over $1 billion in assets.

On average, if this group of credit unions experienced a 30% decline in NII in a +300 bp shock, the resulting ROA would be 3 bps.

But each credit union’s business model and strategy are unique. So instead of looking at the average for this group, let’s look at the potential range of outcomes.

 Based on NCUA data as of 3Q/2016, excluding one credit union that had an exceptionally negative ROA

It is important to note that 47% of all credit unions with assets over $1 billion would have a negative ROA within 12 months if this volatility were to occur.

This enormous range of ROA, and with so many credit unions at risk of negative earnings, helps demonstrate that an interest rate risk limit along these lines could result in material risk with the unintended consequence of institutions being potentially blinded to the exposure of losses.