Posts

What-If Analysis In The Decision-Making Process – Test Your Hypothesis

,

Performing what-if analysis is an integral part of both the A/LM and budget processes. When used correctly, what-if analysis is a powerful way for decision-makers to understand the impact of items under consideration in real-time. The challenge is that often people dive right into modeling and results, producing a less than optimal process. Consider applying a scientific method to the what-if analysis to help strengthen the decision-making process.

The scientific method is essentially a hypothesis-driven methodology. Strong hypotheses lead to expectations either supported or refuted by analysis. What does this all mean? Well, it isn’t as intimidating as it might sound. From a financial modeling perspective, it means don’t just blindly rely on model results.

To help explain this concept further, consider a $1B credit union evaluating a strategy of moving $10M from overnights into 30-year fixed-rate mortgages:

What-If Analysis Test Your Hypothesis as Part of Decision-making Process


Before performing a what-if, the scientific method suggests that you first ask what you expect the results to look like, and then create a hypothesis. Start broadly with what you generally expect to happen to earnings in the current rate environment and the risk. In this case, the shift from overnights to mortgages should help earnings in today’s rate environment, adding risk as rates rise.

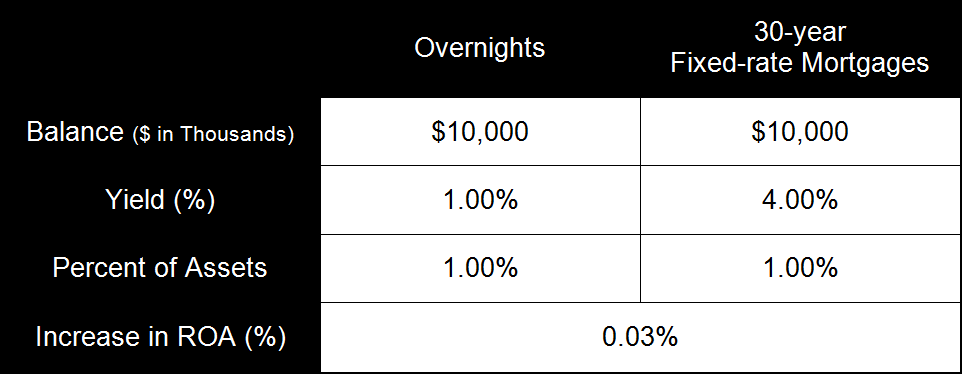
After identifying the broad expectation, take the next step and do some rough math to estimate the return on assets (ROA) impact of the what-if. Here, a $1B institution testing a strategy of moving 1.00% of its assets could expect a 3-basis-point improvement in the initial ROA (1% of assets multiplied by a 3% increase in yield):

What-If Analysis Testing Your Hypothesis as part of decision-making process


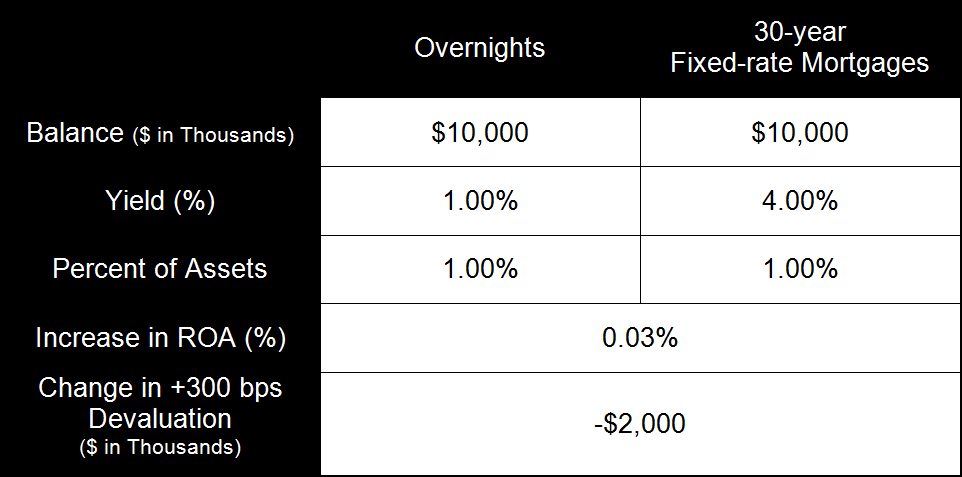
On the risk side, you can do the same with the impact to the net economic value (NEV) dollars since understanding the valuation impact is relatively straightforward. Overnights are at par in all rate environments while brand new 30-year mortgages devalue about 20% in a +300 basis points (bps) rate environment. Therefore, you’d expect to see a roughly $2M decrease in your NEV dollars in the +300 bps rate environment:

What-If Analysis as Part of the Decision-making Process Test Your Hypothesis


Analysis and observation are the next important steps in the scientific method. Run the what-if through the model and analyze the results in comparison to your expectation and rough math. Do the results of the what-if validate the hypothesis and, if not, why?

Periodically, results may not match up with the hypothesis, which is okay. It doesn’t necessarily mean the model or the hypothesis is incorrect. There could be other factors impacting the what-if. However, it is important to figure out why the results do not match up, especially if the difference is due to an input error.

For the example above, consider some of the following questions that could affect the what-if, causing the hypothesis and results not to match:

  • What was the credit risk assumption?
  • Will additional operating expenses and/or marketing dollars be needed to attract the growth?
  • Did we incorporate any fee income for the closing costs?
  • How long will it take to increase the portfolio $10M?


When it comes to the what-if process, shortcuts should not be taken. Always create an expectation internally before relying on model results. Depending exclusively on model results puts the user at risk of input errors and/or an inability to effectively explain what-if results.

Where Is Your Deposit Growth Coming From?

,

Many financial institutions have become increasingly concerned about liquidity and for good reason. While deposit growth is often celebrated, where that growth is coming from can have important implications with respect to liquidity, A/LM, and future plans around membership and asset growth. Is your institution’s deposit growth coming primarily from growth in new accounts or growth in average balances?

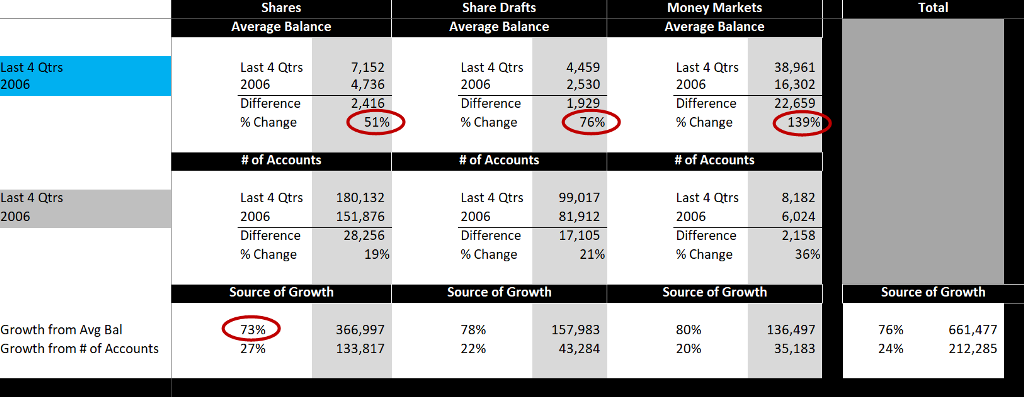
For some credit unions, the change in average deposit balance can represent a substantial risk to maintaining sufficient liquidity. The example data displayed below shows a credit union that over the last 10 years increased average share balances by 51%, share drafts by 76%, and money markets by a whopping 139%.

Where Is Your Deposit Growth Coming From


If you look at the lower portion of the matrix above, note that 73% of growth in shares was from increasing average balances, 27% of the growth was from new accounts. Money markets and share drafts were even more lopsided toward average balance growth. The vast majority of this institution’s deposit growth has come from increasing average balances, as opposed to adding new accounts.

Is this growth because relationships are deeper or is it that members are sitting on more money when the rate alternatives are so low? What could this mean for liquidity exposure, if rates go up or the market gets excited about keeping money somewhere else? Consider that share accounts could be materially more sensitive to moving money than they were in the past. Combine this information with the knowledge that in the last rising rate environment smartphones did not exist—liquidity risk has increased, as it is now easier than ever to move money.

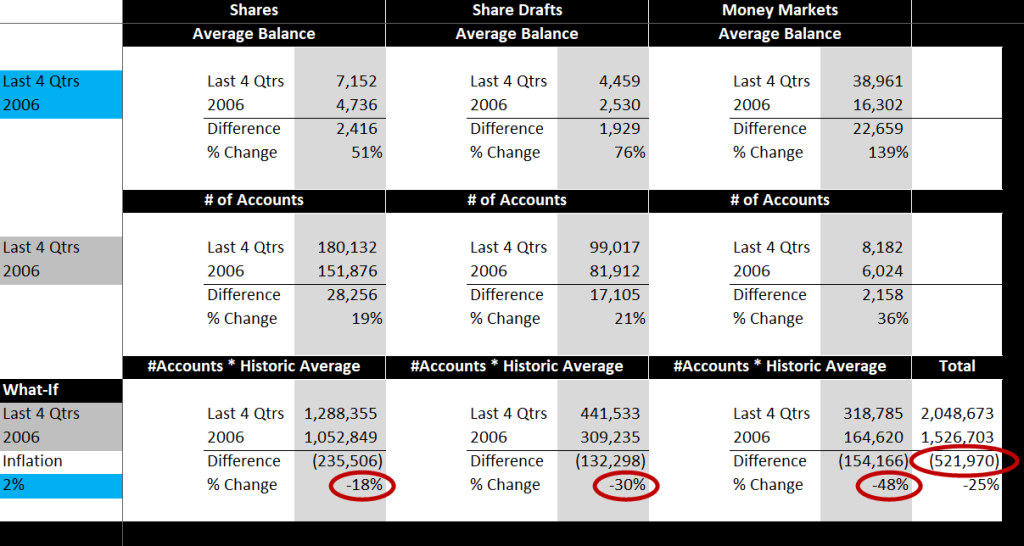
Another way to look at this could be to consider what the deposit growth matrix would look like if the growth were pegged to inflation (conservatively assuming a 2% inflation rate over the last 10 years). If average balances grew at a 2% annualized rate, the credit union would have accumulated 18% less in regular shares, 30% less in share drafts, and 48% less in money markets. This would represent almost $522M fewer deposit dollars over the same 10-year period.

Where Is Your Deposit Growth Coming From


Additionally, if a credit union has become more active in indirect lending, it is important to understand how indirect members are impacting average deposit balances (since indirect members often carry small or minimum share balances). If indirect account holders are excluded, the average share balance utilizing the same example credit union would have increased by 63% over the same period of time (compared to 51% including indirect members), and increases in average balances would account for 94% of the growth in shares as opposed to 73%. For some credit unions, the impact of indirect members could be more significant.

From a policy perspective, having this type of data readily available can help to inform contingency funding plans and how you stress your liquidity simulations. Some credit unions evaluate their bad case liquidity scenario by analyzing growth in average balances over time and assuming that a portion of that “excess” growth leaves the credit union. This can help put some historical context around your liquidity stress testing.

Financial institutions are potentially entering unprecedented territory with respect to the pattern of interest rates, and how members will behave is unknown. As you plan for liquidity, consider evaluating how your average deposit relationships have changed, what it could mean for your institution, and what you could do now to prepare.

C. myers has posted several entries on our blog over the last year about this important topic. Click here to see more.

What-Ifs Help the Budget Process

, ,

Testing ideas and running what-ifs is a powerful way for decision-makers to understand the impact of decisions under consideration in real-time (for more on this, please refer to our blog, Has your ALM technology Emerged from the Dark Ages?).  The power of what-ifs can also be applied to the budgeting process, and help link decisions made in the budget to the impact on a credit union’s risk by answering three risk-related business questions:

  1. How much could current earnings change if decisions under consideration are implemented?
  2. What are the profitability and risk trade-offs of decisions under consideration if rates change?
  3. What is the break-even point of decisions under consideration?

Budgets help answer the first question and don’t address the next two questions. The answers to these two questions could impact the credit union’s ability to deliver on its strategy.

Credit unions should create a target financial structure by running their budget through their risk model to understand the overall risk of the budget coming true (for more on this, please refer to our blog, Testing the Budget’s Interest Rate Risk). What-ifs help decision-makers evaluate the risk trade-offs of key decisions and forecasts during the budgeting process.

Not all decisions need to be run through the risk model during the budget process – this is how the target financial structure is helpful. Rather, decision-makers can test three or four of the key decisions or expectations that are driving the budget, both for revenue and expenses, and run a what-if to quickly understand the risk impact.

An example might be that the lending department believes they can generate a high amount of growth in mortgages in the coming year. This would be a key driver of revenue for the credit union. Decision-makers can run a what-if on this expectation and determine if they are comfortable with the risk/return trade-off.

Using what-ifs allow decision-makers to be more nimble during the budgeting process, and make changes along the way if they determine the risk/return trade-offs of key initiatives are out of their comfort zone.

NEV: Things to Remember

Net economic value (NEV) will not show you the effect on current earnings when testing risk-mitigating strategies.

To illustrate, assume a credit union concerned about its interest rate risk is considering selling all of its 30-year, fixed-rate, 1st mortgages. The credit union plans to put the proceeds into overnights to give themselves the best hedge against rising rates. As part of the credit union’s decision-making process, a “what if” is run off the most recent NEV analysis. After reviewing the results of the “what if,” the decision is made to sell the mortgages. Why?

As indicated in the table above, the “what if” shows that selling the mortgages today does not hurt the starting NEV, but it does help NEV if rates increase 300 basis points (bps). The decision was a “no-brainer” for the credit union.

The reason the results look like this is that NEV is the fair value of assets less the fair value of liabilities. In the current rate environment, the base case NEV results already included the small loss the credit union expected to take upon sale of the mortgages. That total sale price would be invested into overnights (at par). In a +300 bp rate change, the base case NEV results included the devaluation of the mortgages. However, in a +300 bp environment, overnights are still valued at par. So the “what if” results showed that there was no change to the current NEV, and in a +300 bp rate change, it showed less risk.

What about the earnings trade-off? Selling all of the credit union’s mortgages and putting the proceeds into overnights does help its risk in a rising rate environment, but at the cost of over 100 bps in ROA today. Using NEV as the primary decision-making tool did nothing to show the credit union the “risk-return trade-off.” NEV also will not help the credit union answer the question: “after selling the mortgages, how high would rates have to go before reaching a breakeven point from an earnings perspective?”

What If The Fed Rate Projection Is Right?

This is a question credit unions should try to answer as part of their ongoing long-term forecasting process.  The FOMC reaffirmed on Wednesday (December 12) that they do not anticipate raising rates until 2015.

Source:  Federal Reserve

So what happens to earnings and net worth if rates stay at historic lows for two more years, and then start to rise? Instinctively, the net interest margin should be squeezed over the next two years as assets continue to reprice down without a corresponding reduction in the cost of funds. The big unknown is: how much and how fast will rates rise?

Credit unions may need to run a series of “what-ifs” to understand the impact. “What-ifs” should include rates rising over different time periods (i.e., 12 months, 24 months, etc.) and increase to different levels (i.e., 100bps, 200bps, 300bps).  It would also be prudent to test changes in balance sheet mix, as rates may rise for different reasons.  If the economy is booming, then the credit union may be able to originate more loans.  This would help the bottom line and possibly mitigate the impact of the lower-yielding assets brought on in 2013 and 2014.  However, if the economy is stagnant, loan growth could be an issue—which would hurt earnings and net worth.

Decision-makers should review the series of “what-ifs” and discuss any areas of concern.  Credit unions should run additional “what-ifs” that address their concerns—particularly in cases where success measures would not be met or the credit union’s ability to deliver on its strategic objectives is threatened.